Visualising metrics using Grafana
2 minute read
Envoy Gateway provides support for exposing Envoy Proxy metrics to a Prometheus instance. This guide shows you how to visualise the metrics exposed to prometheus using grafana.
Prerequisites
Follow the steps from the Quickstart to install Envoy Gateway and the example manifest. Before proceeding, you should be able to query the example backend using HTTP.
Follow the steps from the Proxy Observability to enable prometheus metrics.
Prometheus is used to scrape metrics from the Envoy Proxy instances. Install Prometheus:
helm repo add prometheus-community https://prometheus-community.github.io/helm-charts
helm repo update
helm upgrade --install prometheus prometheus-community/prometheus -n monitoring --create-namespace
Grafana is used to visualise the metrics exposed by the envoy proxy instances. Install Grafana:
helm repo add grafana https://grafana.github.io/helm-charts
helm repo update
helm upgrade --install grafana grafana/grafana -f https://raw.githubusercontent.com/envoyproxy/gateway/latest/examples/grafana/helm-values.yaml -n monitoring --create-namespace
Expose endpoints:
GRAFANA_IP=$(kubectl get svc grafana -n monitoring -o jsonpath='{.status.loadBalancer.ingress[0].ip}')
Connecting Grafana with Prometheus datasource
To visualise metrics from Prometheus, we have to connect Grafana with Prometheus. If you installed Grafana from the command from prerequisites sections, the prometheus datasource should be already configured.
You can also add the data source manually by following the instructions from Grafana Docs.
Accessing Grafana
You can access the Grafana instance by visiting http://{GRAFANA_IP}, derived in prerequisites.
To log in to Grafana, use the credentials admin:admin.
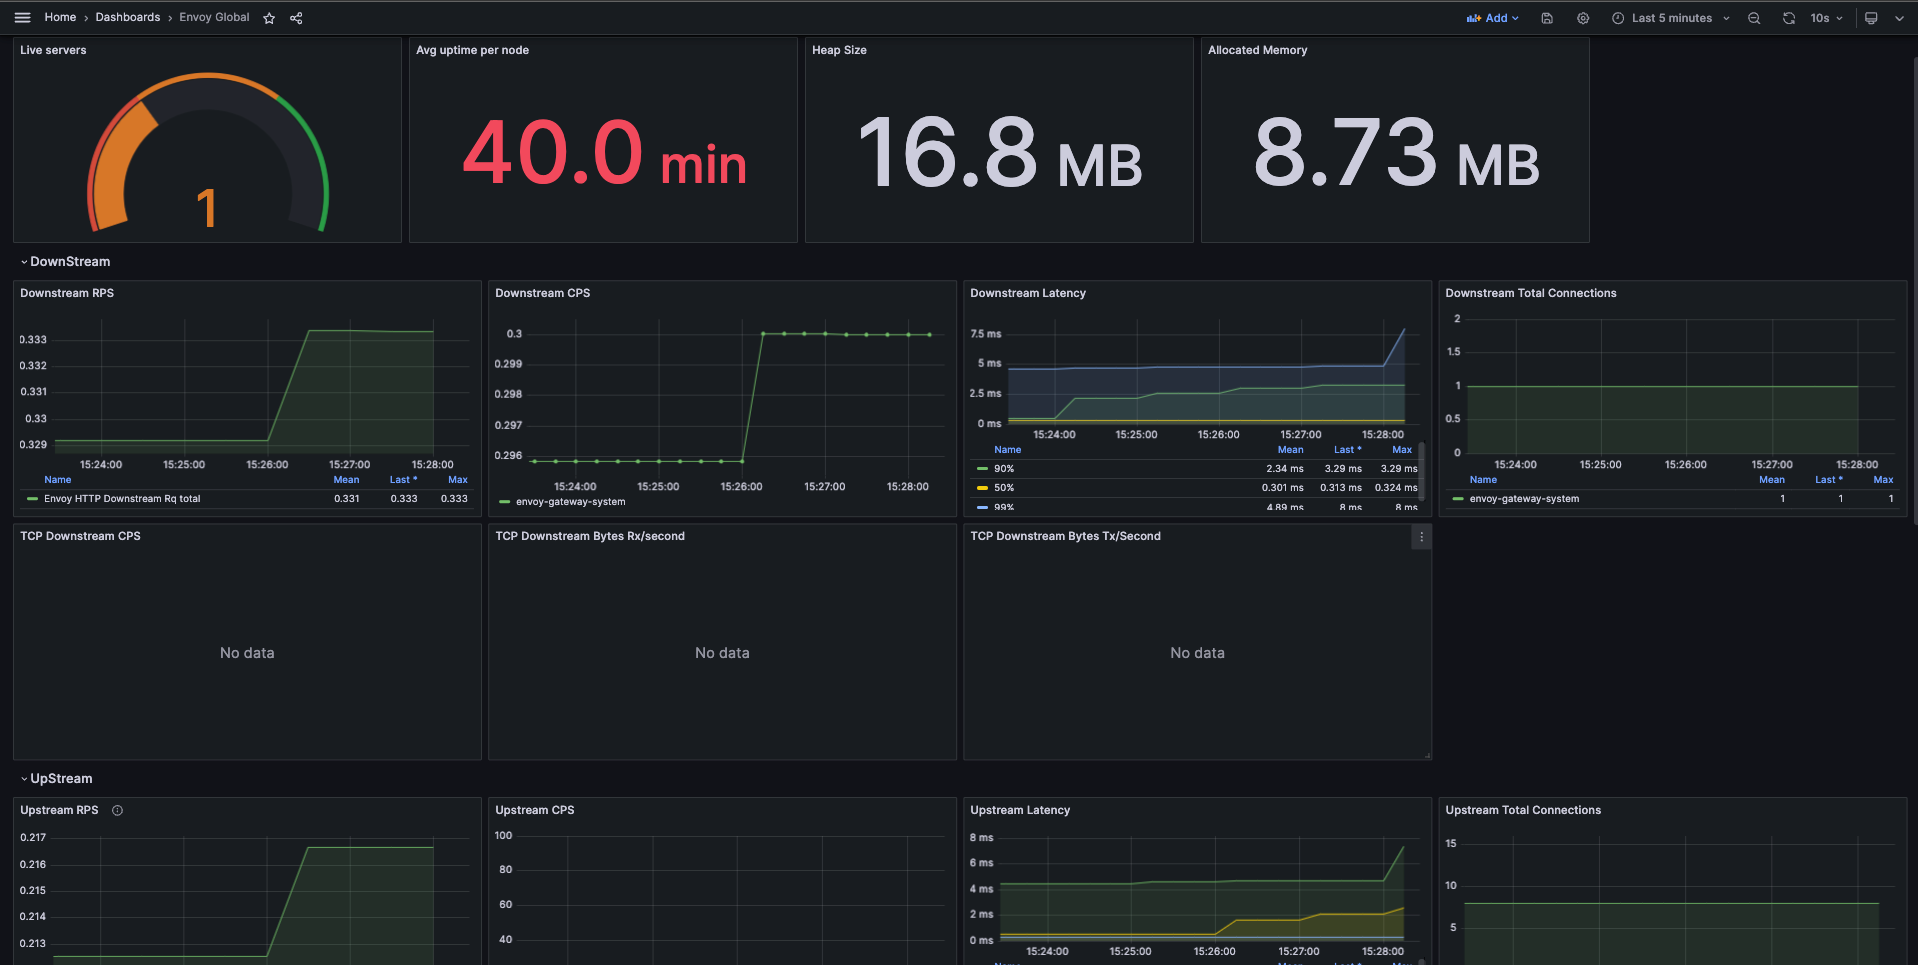
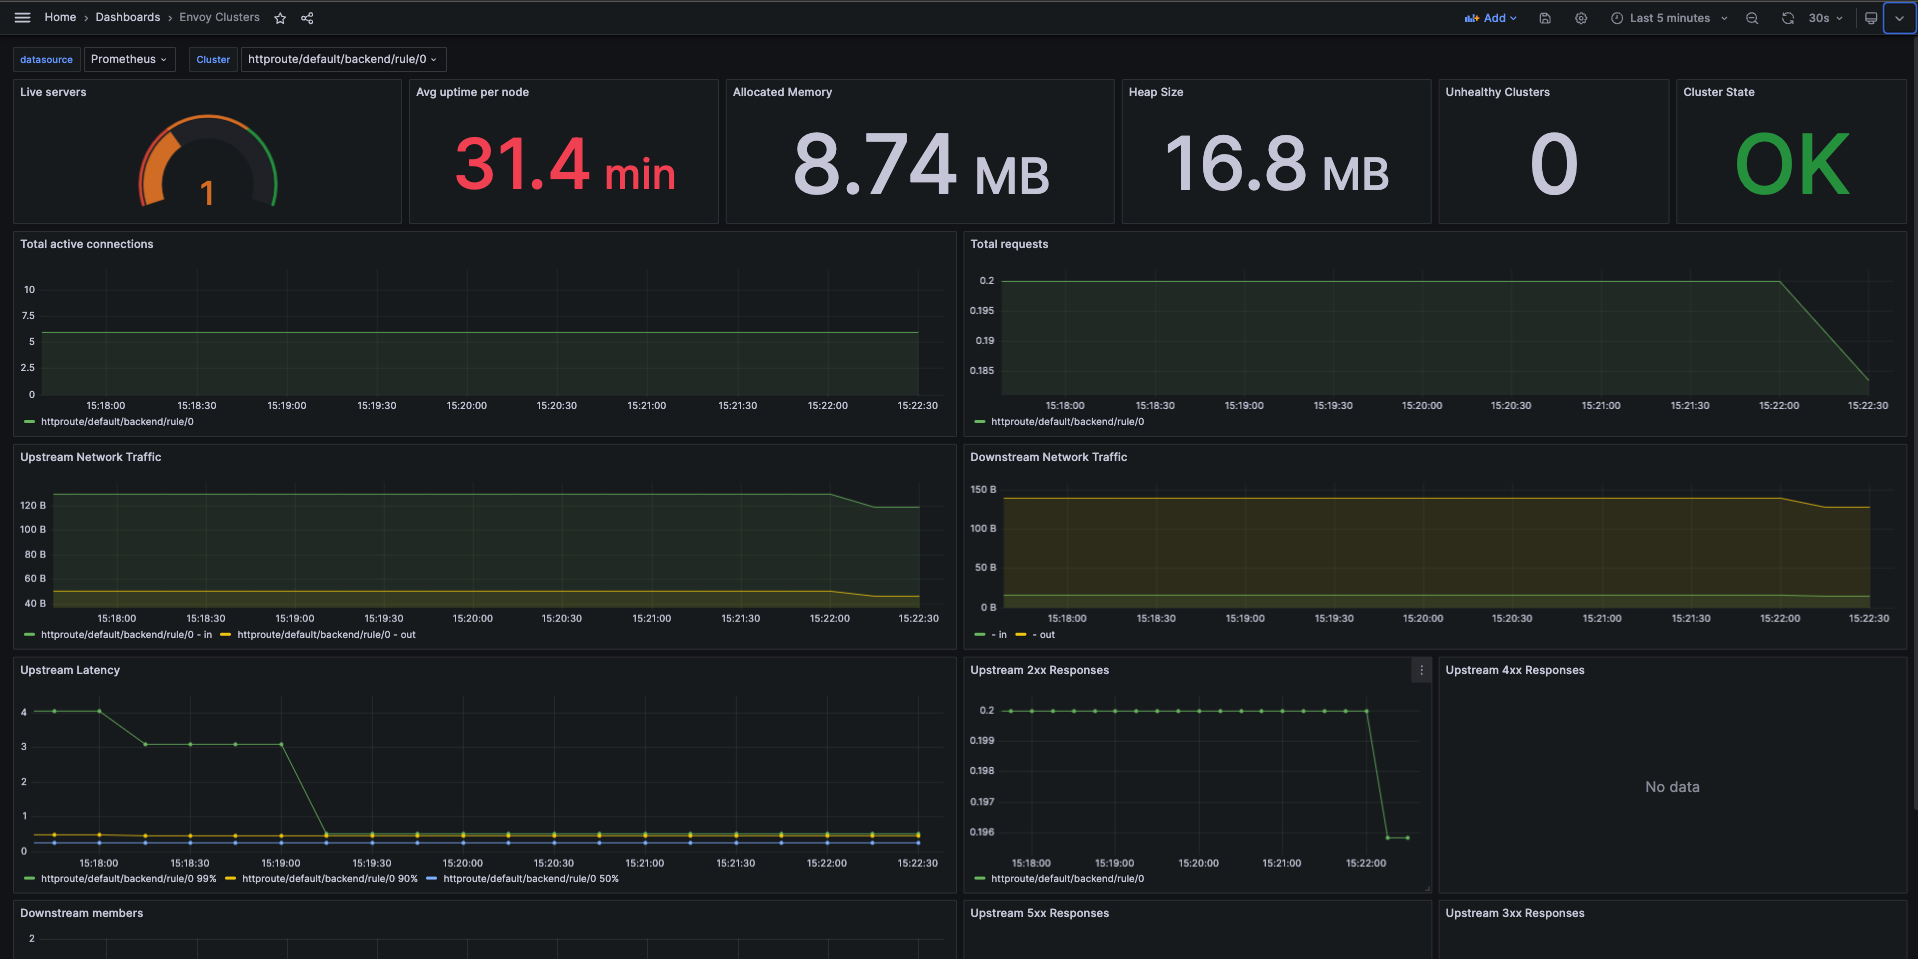
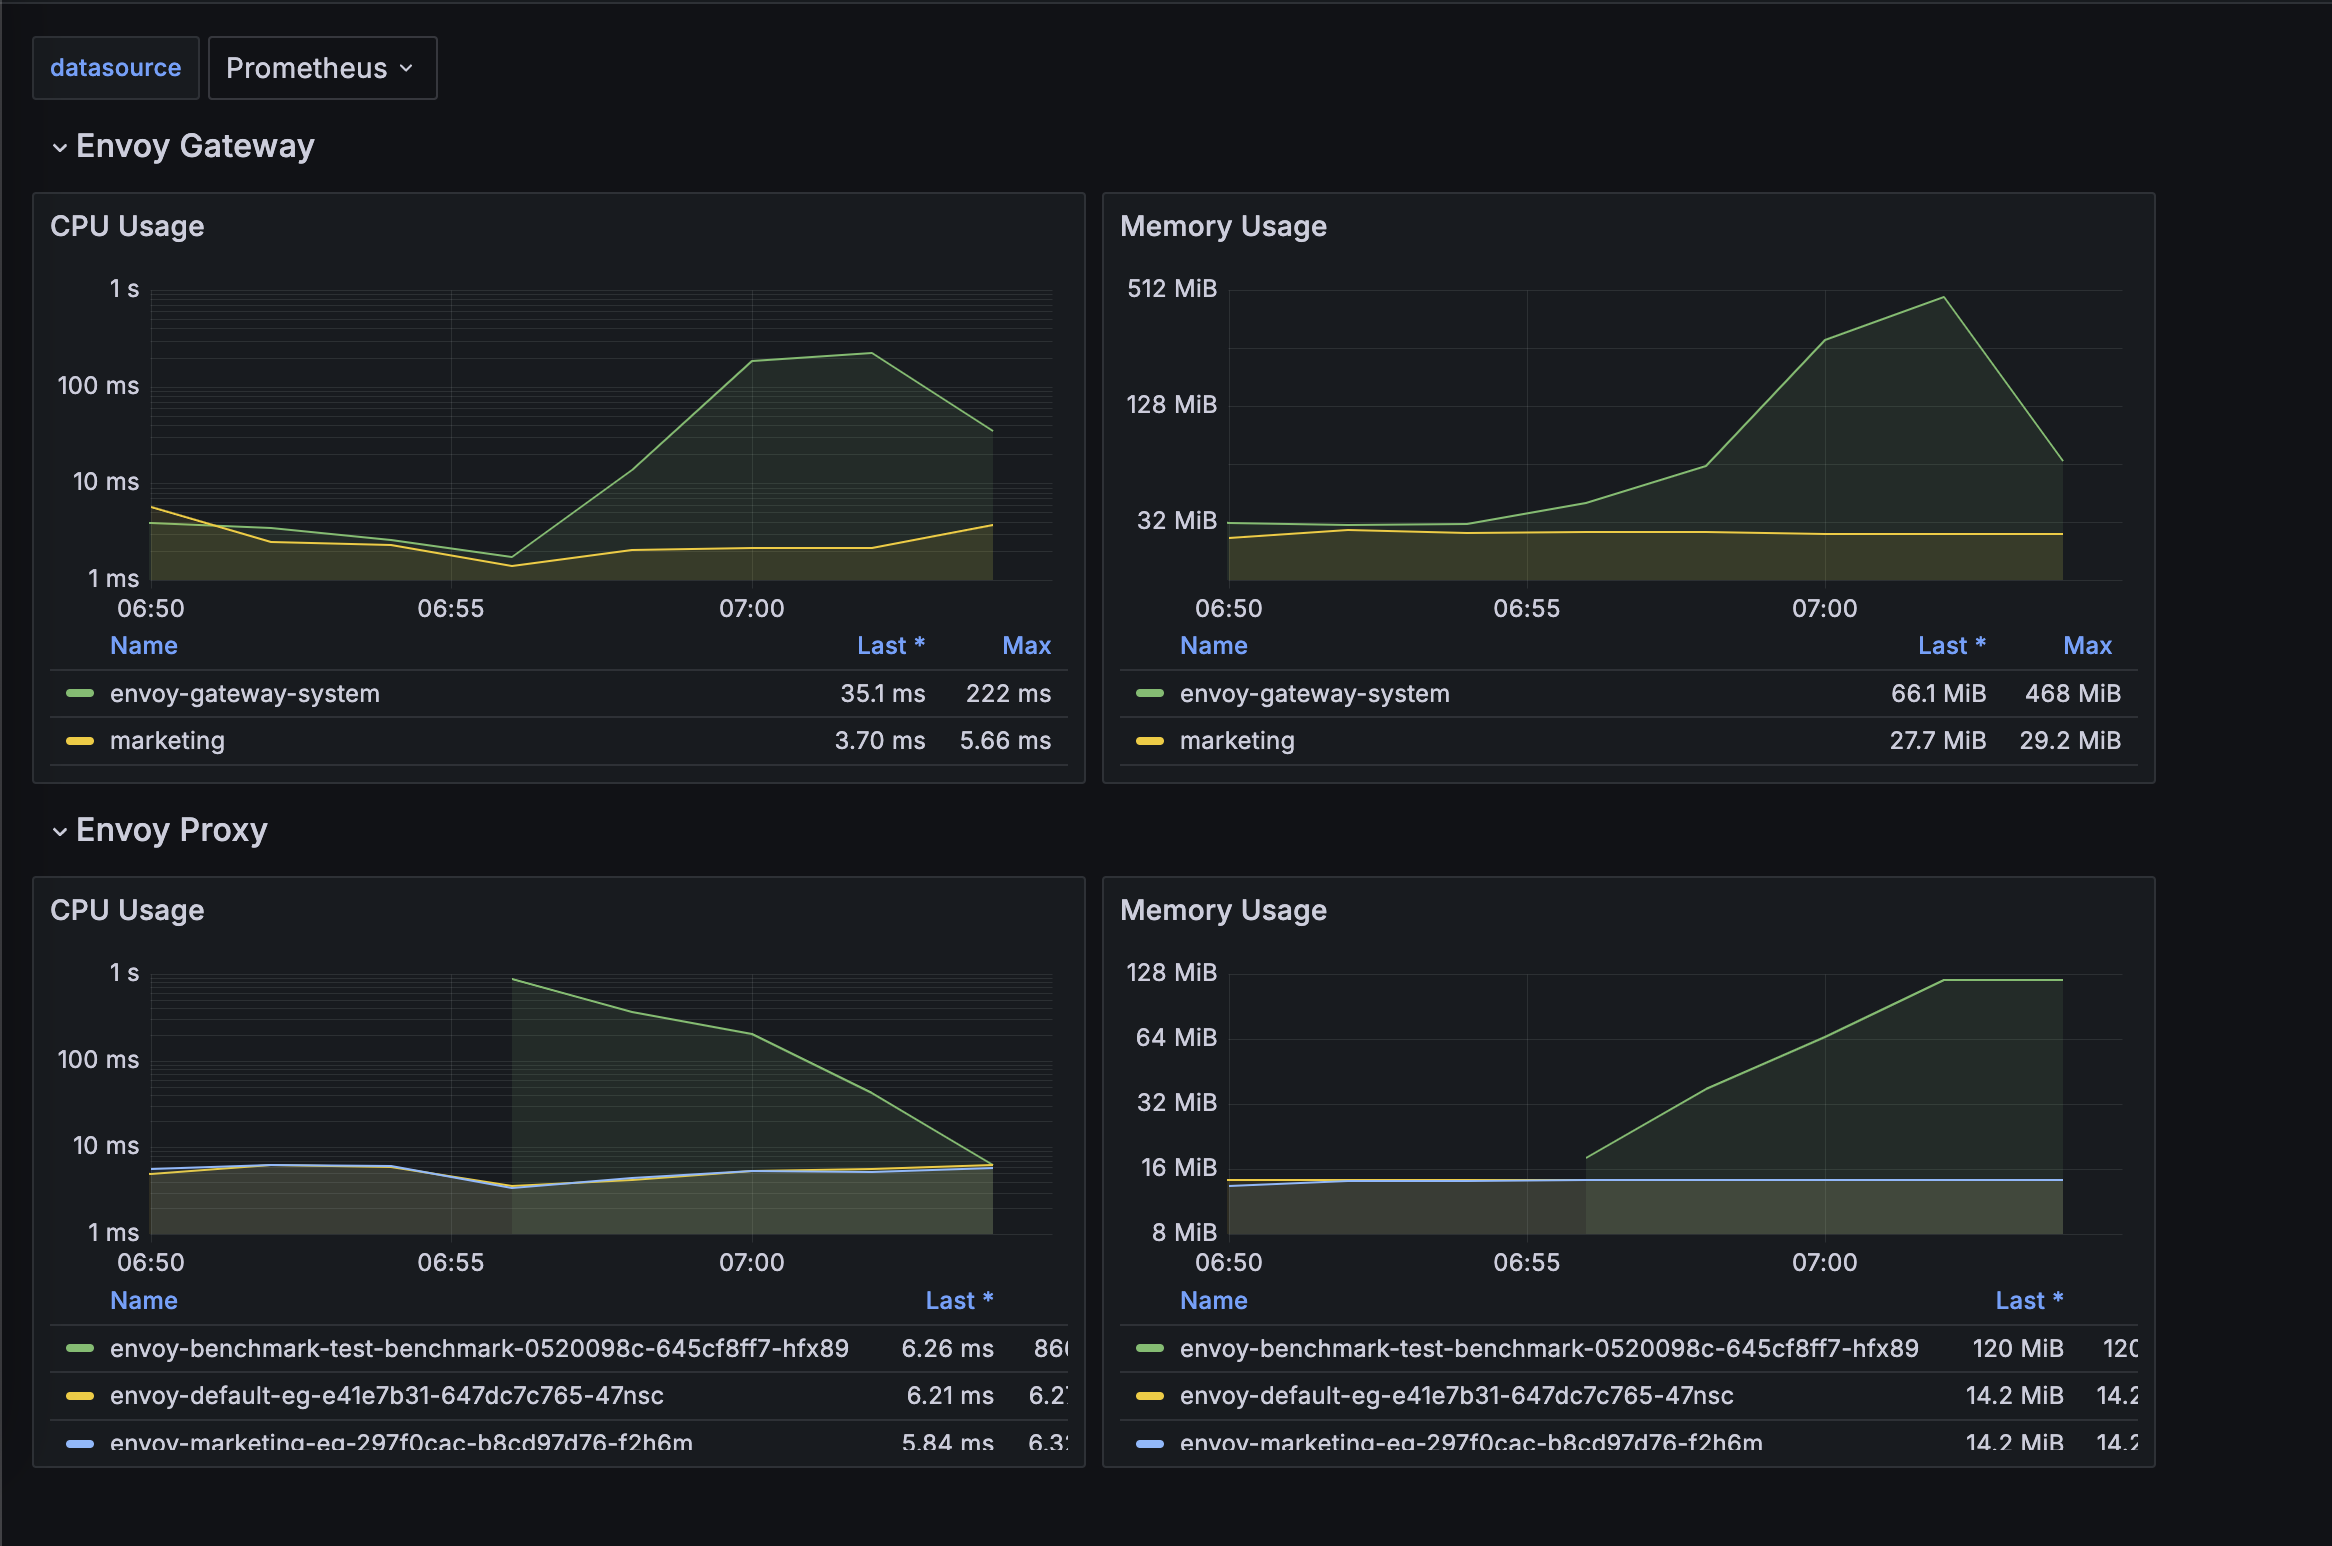
Envoy Gateway has examples of dashboard for you to get started:
Envoy Proxy Global

Envoy Clusters

Envoy Pod Resources

You can load the above dashboards in your Grafana to get started. Please refer to Grafana docs for importing dashboards.
Feedback
Was this page helpful?
Glad to hear it! Please tell us how we can improve.
Sorry to hear that. Please tell us how we can improve.