This is the multi-page printable view of this section. Click here to print.
Observability
1 - Gateway API Metrics
Resource metrics for Gateway API objects are available using the Gateway API State Metrics project. The project also provides example dashboard for visualising the metrics using Grafana, and example alerts using Prometheus & Alertmanager.
Prerequisites
Follow the steps from the Quickstart to install Envoy Gateway and the example manifest. Before proceeding, you should be able to query the example backend using HTTP.
Run the following commands to install the metrics stack, with the Gateway API State Metrics configuration, on your kubernetes cluster:
kubectl apply --server-side -f https://raw.githubusercontent.com/Kuadrant/gateway-api-state-metrics/main/config/examples/kube-prometheus/bundle_crd.yaml
kubectl apply -f https://raw.githubusercontent.com/Kuadrant/gateway-api-state-metrics/main/config/examples/kube-prometheus/bundle.yaml
Metrics and Alerts
To access the Prometheus UI, wait for the statefulset to be ready, then use the port-forward command:
# This first command may fail if the statefulset has not been created yet.
# In that case, try again until you get a message like 'Waiting for 2 pods to be ready...'
# or 'statefulset rolling update complete 2 pods...'
kubectl -n monitoring rollout status --watch --timeout=5m statefulset/prometheus-k8s
kubectl -n monitoring port-forward service/prometheus-k8s 9090:9090 > /dev/null &
Navigate to http://localhost:9090.
Metrics can be queried from the ‘Graph’ tab e.g. gatewayapi_gateway_created
See the Gateway API State Metrics README for the full list of Gateway API metrics available.
Alerts can be seen in the ‘Alerts’ tab. Gateway API specific alerts will be grouped under the ‘gateway-api.rules’ heading.
Note: Alerts are defined in a PrometheusRules custom resource in the ‘monitoring’ namespace. You can modify the alert rules by updating this resource.
Dashboards
To view the dashboards in Grafana, wait for the deployment to be ready, then use the port-forward command:
kubectl -n monitoring wait --timeout=5m deployment/grafana --for=condition=Available
kubectl -n monitoring port-forward service/grafana 3000:3000 > /dev/null &
Navigate to http://localhost:3000 and sign in with admin/admin.
The Gateway API State dashboards will be available in the ‘Default’ folder and tagged with ‘gateway-api’.
See the Gateway API State Metrics README for further information on available dashboards.
Note: Dashboards are loaded from configmaps. You can modify the dashboards in the Grafana UI, however you will need to export them from the UI and update the json in the configmaps to persist changes.
2 - Proxy Observability
Envoy Gateway provides observability for the ControlPlane and the underlying EnvoyProxy instances. This guide show you how to config proxy observability, includes metrics, logs, and traces.
Prerequisites
Follow the steps from the Quickstart to install Envoy Gateway and the example manifest. Before proceeding, you should be able to query the example backend using HTTP.
FluentBit is used to collect logs from the EnvoyProxy instances and forward them to Loki. Install FluentBit:
helm repo add fluent https://fluent.github.io/helm-charts
helm repo update
helm upgrade --install fluent-bit fluent/fluent-bit -f https://raw.githubusercontent.com/envoyproxy/gateway/latest/examples/fluent-bit/helm-values.yaml -n monitoring --create-namespace --version 0.30.4
Loki is used to store logs. Install Loki:
kubectl apply -f https://raw.githubusercontent.com/envoyproxy/gateway/latest/examples/loki/loki.yaml -n monitoring
Tempo is used to store traces. Install Tempo:
helm repo add grafana https://grafana.github.io/helm-charts
helm repo update
helm upgrade --install tempo grafana/tempo -f https://raw.githubusercontent.com/envoyproxy/gateway/latest/examples/tempo/helm-values.yaml -n monitoring --create-namespace --version 1.3.1
OpenTelemetry Collector offers a vendor-agnostic implementation of how to receive, process and export telemetry data. Install OTel-Collector:
helm repo add open-telemetry https://open-telemetry.github.io/opentelemetry-helm-charts
helm repo update
helm upgrade --install otel-collector open-telemetry/opentelemetry-collector -f https://raw.githubusercontent.com/envoyproxy/gateway/latest/examples/otel-collector/helm-values.yaml -n monitoring --create-namespace --version 0.60.0
Expose endpoints:
LOKI_IP=$(kubectl get svc loki -n monitoring -o jsonpath='{.status.loadBalancer.ingress[0].ip}')
TEMPO_IP=$(kubectl get svc tempo -n monitoring -o jsonpath='{.status.loadBalancer.ingress[0].ip}')
Metrics
By default, Envoy Gateway expose metrics with prometheus endpoint.
Verify metrics:
export ENVOY_POD_NAME=$(kubectl get pod -n envoy-gateway-system --selector=gateway.envoyproxy.io/owning-gateway-namespace=default,gateway.envoyproxy.io/owning-gateway-name=eg -o jsonpath='{.items[0].metadata.name}')
kubectl port-forward pod/$ENVOY_POD_NAME -n envoy-gateway-system 19001:19001

# check metrics
curl localhost:19001/stats/prometheus  | grep "default/backend/rule/0/match/0-www"
You can disable metrics by setting the telemetry.metrics.prometheus.disable to true in the EnvoyProxy CRD.
kubectl apply -f https://raw.githubusercontent.com/envoyproxy/gateway/latest/examples/kubernetes/metric/disable-prometheus.yaml
Envoy Gateway can send metrics to OpenTelemetry Sink. Send metrics to OTel-Collector:
kubectl apply -f https://raw.githubusercontent.com/envoyproxy/gateway/latest/examples/kubernetes/metric/otel-sink.yaml
Verify OTel-Collector metrics:
export OTEL_POD_NAME=$(kubectl get pod -n monitoring --selector=app.kubernetes.io/name=opentelemetry-collector -o jsonpath='{.items[0].metadata.name}')
kubectl port-forward pod/$OTEL_POD_NAME -n monitoring 19001:19001

# check metrics
curl localhost:19001/metrics  | grep "default/backend/rule/0/match/0-www"
Logs
If custom format string is not specified, Envoy Gateway uses the following default format:
{"start_time":"%START_TIME%","method":"%REQ(:METHOD)%","x-envoy-origin-path":"%REQ(X-ENVOY-ORIGINAL-PATH?:PATH)%","protocol":"%PROTOCOL%","response_code":"%RESPONSE_CODE%","response_flags":"%RESPONSE_FLAGS%","response_code_details":"%RESPONSE_CODE_DETAILS%","connection_termination_details":"%CONNECTION_TERMINATION_DETAILS%","upstream_transport_failure_reason":"%UPSTREAM_TRANSPORT_FAILURE_REASON%","bytes_received":"%BYTES_RECEIVED%","bytes_sent":"%BYTES_SENT%","duration":"%DURATION%","x-envoy-upstream-service-time":"%RESP(X-ENVOY-UPSTREAM-SERVICE-TIME)%","x-forwarded-for":"%REQ(X-FORWARDED-FOR)%","user-agent":"%REQ(USER-AGENT)%","x-request-id":"%REQ(X-REQUEST-ID)%",":authority":"%REQ(:AUTHORITY)%","upstream_host":"%UPSTREAM_HOST%","upstream_cluster":"%UPSTREAM_CLUSTER%","upstream_local_address":"%UPSTREAM_LOCAL_ADDRESS%","downstream_local_address":"%DOWNSTREAM_LOCAL_ADDRESS%","downstream_remote_address":"%DOWNSTREAM_REMOTE_ADDRESS%","requested_server_name":"%REQUESTED_SERVER_NAME%","route_name":"%ROUTE_NAME%"}
Note: Envoy Gateway disable envoy headers by default, you can enable it by setting
EnableEnvoyHeaderstotruein the ClientTrafficPolicy CRD.
Verify logs from loki:
curl -s "http://$LOKI_IP:3100/loki/api/v1/query_range" --data-urlencode "query={job=\"fluentbit\"}" | jq '.data.result[0].values'
If you want to disable it, set the telemetry.accesslog.disable to true in the EnvoyProxy CRD.
kubectl apply -f https://raw.githubusercontent.com/envoyproxy/gateway/latest/examples/kubernetes/accesslog/disable-accesslog.yaml
Envoy Gateway can send logs to OpenTelemetry Sink.
kubectl apply -f https://raw.githubusercontent.com/envoyproxy/gateway/latest/examples/kubernetes/accesslog/otel-accesslog.yaml
Verify logs from loki:
curl -s "http://$LOKI_IP:3100/loki/api/v1/query_range" --data-urlencode "query={exporter=\"OTLP\"}" | jq '.data.result[0].values'
Traces
By default, Envoy Gateway doesn’t send traces to OpenTelemetry Sink.
You can enable traces by setting the telemetry.tracing in the EnvoyProxy CRD.
Note: Envoy Gateway use 100% sample rate, which means all requests will be traced. This may cause performance issues.
kubectl apply -f https://raw.githubusercontent.com/envoyproxy/gateway/latest/examples/kubernetes/tracing/default.yaml
Verify traces from tempo:
curl -s "http://$TEMPO_IP:3100/api/search" --data-urlencode "q={ component=envoy }" | jq .traces
curl -s "http://$TEMPO_IP:3100/api/traces/<trace_id>" | jq
3 - Visualising metrics using Grafana
Envoy Gateway provides support for exposing Envoy Proxy metrics to a Prometheus instance. This guide shows you how to visualise the metrics exposed to prometheus using grafana.
Prerequisites
Follow the steps from the Quickstart to install Envoy Gateway and the example manifest. Before proceeding, you should be able to query the example backend using HTTP.
Follow the steps from the Proxy Observability to enable prometheus metrics.
Prometheus is used to scrape metrics from the Envoy Proxy instances. Install Prometheus:
helm repo add prometheus-community https://prometheus-community.github.io/helm-charts
helm repo update
helm upgrade --install prometheus prometheus-community/prometheus -n monitoring --create-namespace
Grafana is used to visualise the metrics exposed by the envoy proxy instances. Install Grafana:
helm repo add grafana https://grafana.github.io/helm-charts
helm repo update
helm upgrade --install grafana grafana/grafana -f https://raw.githubusercontent.com/envoyproxy/gateway/latest/examples/grafana/helm-values.yaml -n monitoring --create-namespace
Expose endpoints:
GRAFANA_IP=$(kubectl get svc grafana -n monitoring -o jsonpath='{.status.loadBalancer.ingress[0].ip}')
Connecting Grafana with Prometheus datasource
To visualise metrics from Prometheus, we have to connect Grafana with Prometheus. If you installed Grafana from the command from prerequisites sections, the prometheus datasource should be already configured.
You can also add the data source manually by following the instructions from Grafana Docs.
Accessing Grafana
You can access the Grafana instance by visiting http://{GRAFANA_IP}, derived in prerequisites.
To log in to Grafana, use the credentials admin:admin.
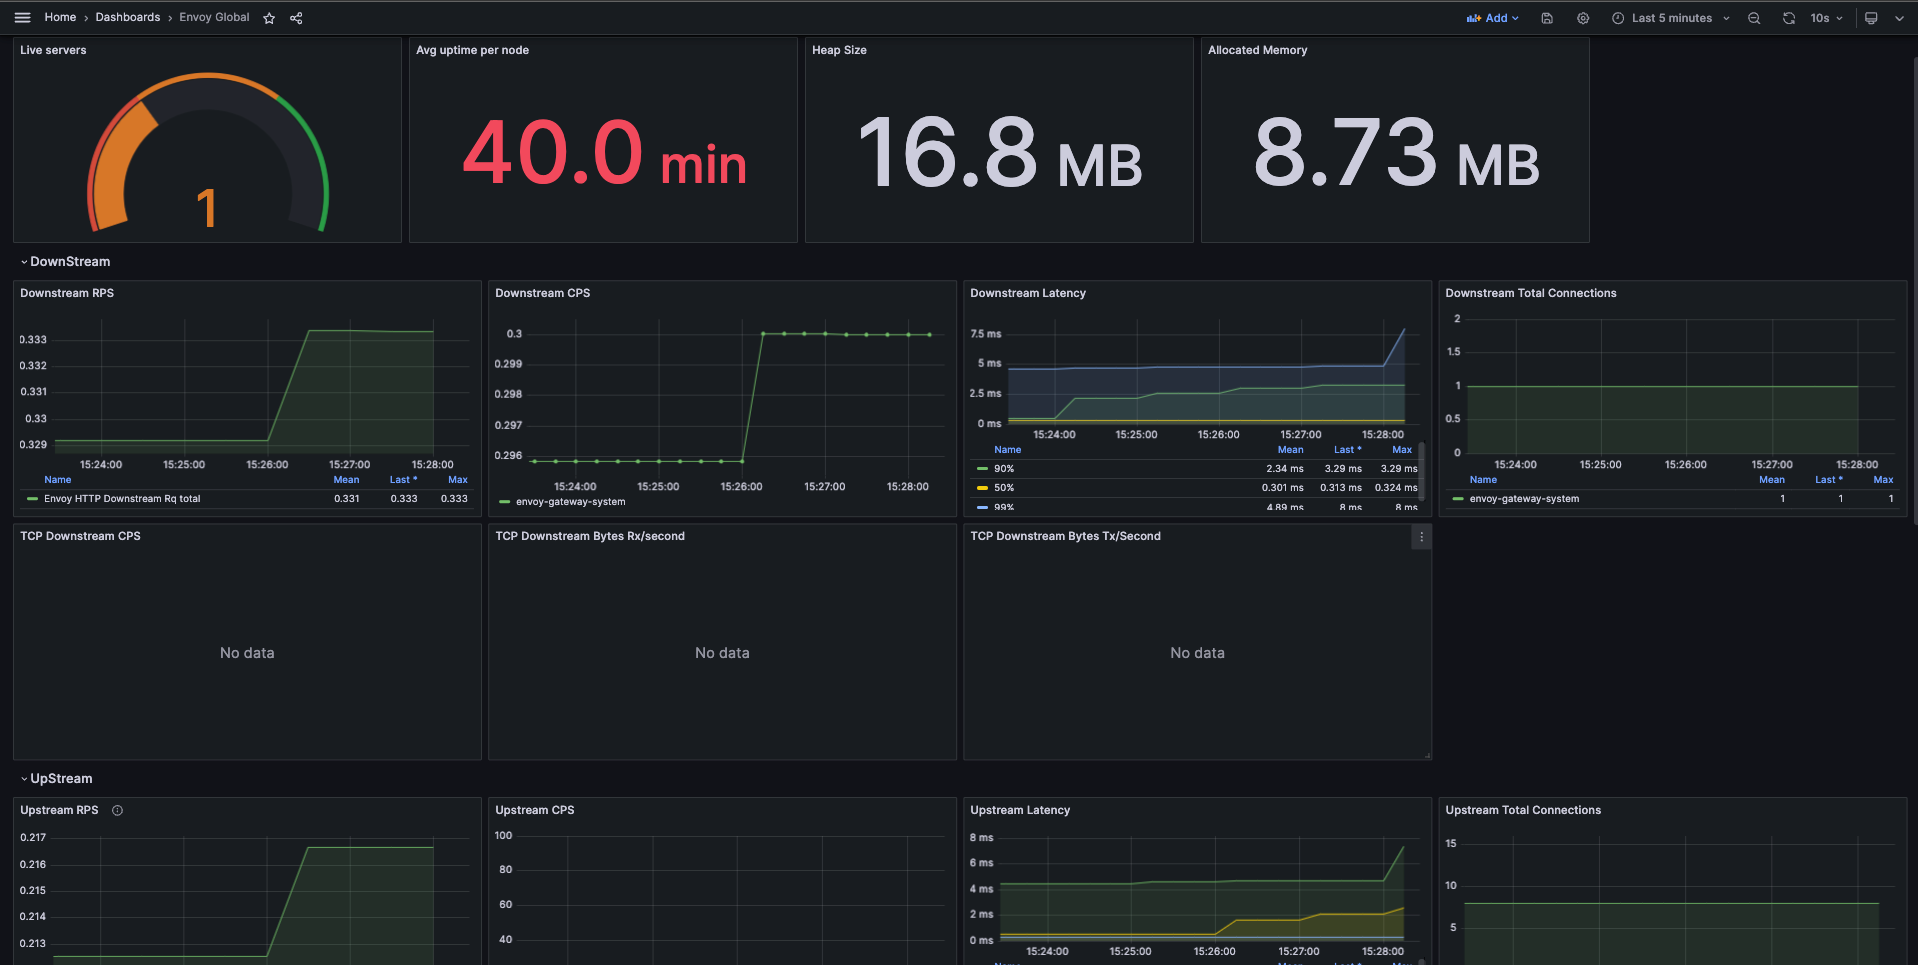
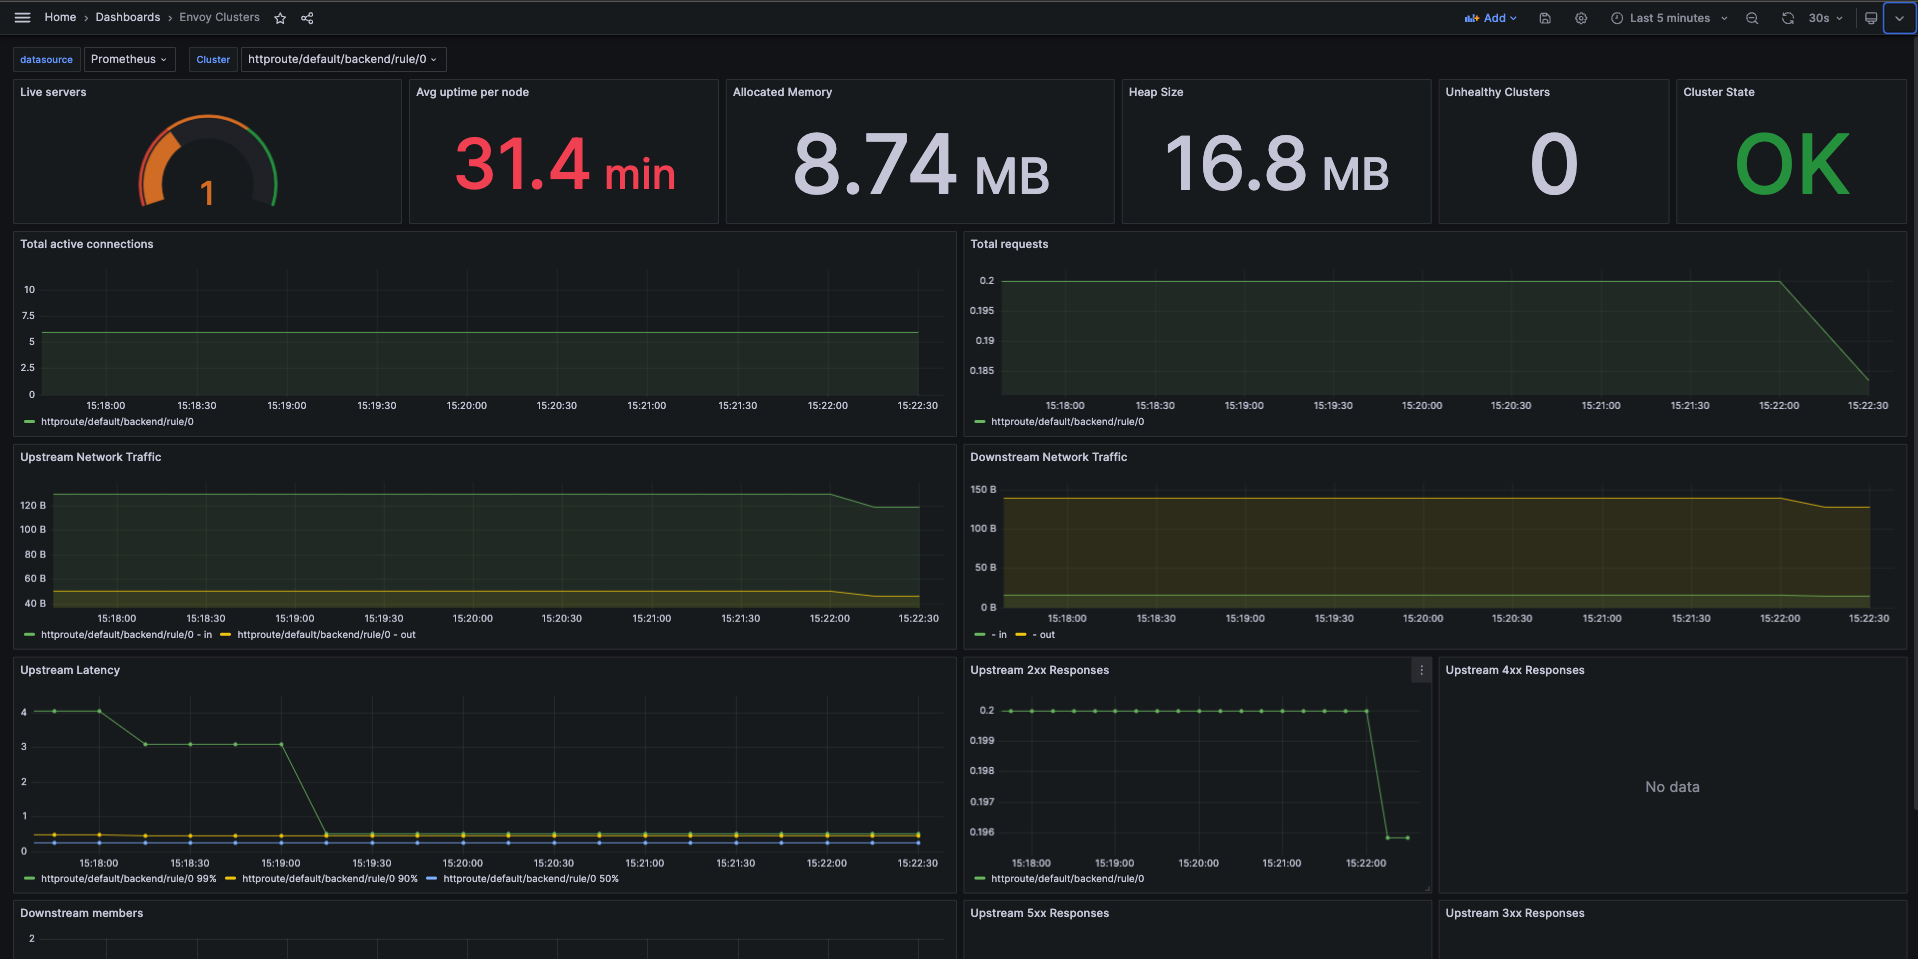
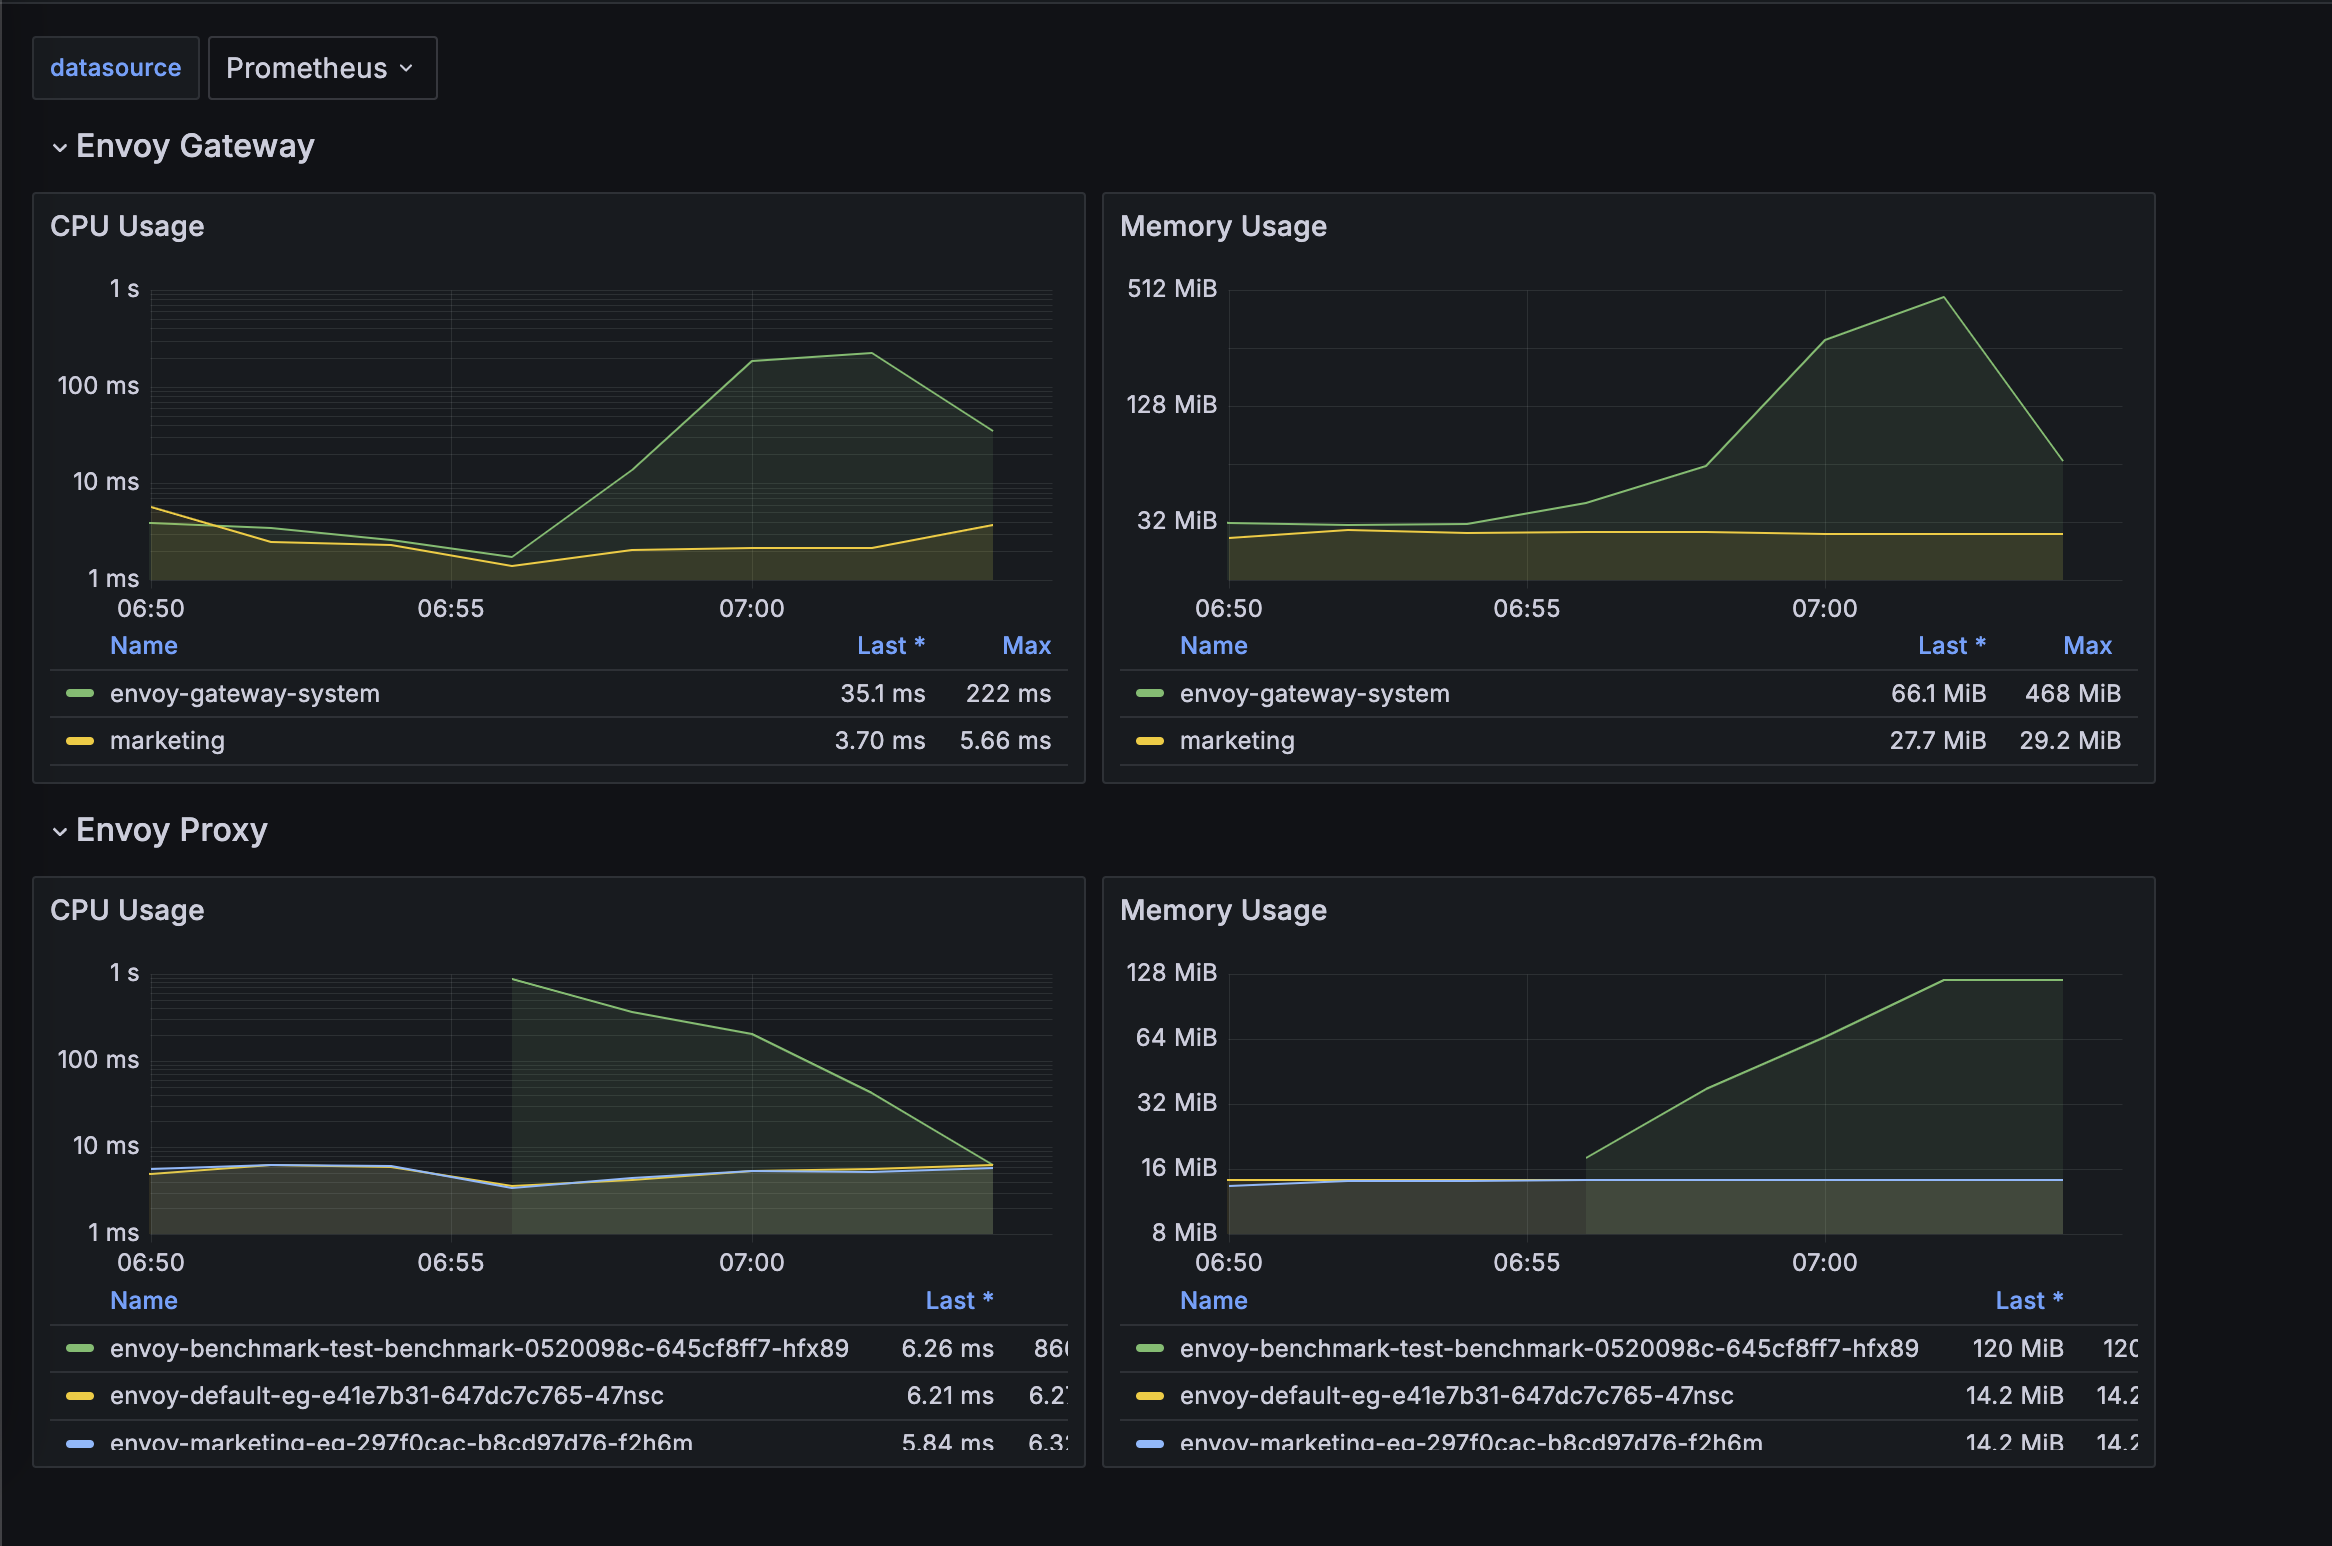
Envoy Gateway has examples of dashboard for you to get started:
Envoy Proxy Global
Envoy Clusters
Envoy Pod Resources
You can load the above dashboards in your Grafana to get started. Please refer to Grafana docs for importing dashboards.