Visualising metrics using Grafana
3 minute read
Envoy Gateway provides support for exposing Envoy Gateway and Envoy Proxy metrics to a Prometheus instance. This task shows you how to visualise the metrics exposed to Prometheus using Grafana.
Prerequisites
Install Envoy Gateway
Follow the steps below to install Envoy Gateway and the example manifest. Before proceeding, you should be able to query the example backend using HTTP.
Expand for instructions
Install the Gateway API CRDs and Envoy Gateway using Helm:
helm install eg oci://docker.io/envoyproxy/gateway-helm --version v1.7.1 -n envoy-gateway-system --create-namespaceInstall the GatewayClass, Gateway, HTTPRoute and example app:
kubectl apply -f https://github.com/envoyproxy/gateway/releases/download/v1.7.1/quickstart.yaml -n defaultVerify Connectivity:
Get the External IP of the Gateway:
export GATEWAY_HOST=$(kubectl get gateway/eg -o jsonpath='{.status.addresses[0].value}')Curl the example app through Envoy proxy:
curl --verbose --header "Host: www.example.com" http://$GATEWAY_HOST/getThe above command should succeed with status code 200.
Get the name of the Envoy service created the by the example Gateway:
export ENVOY_SERVICE=$(kubectl get svc -n envoy-gateway-system --selector=gateway.envoyproxy.io/owning-gateway-namespace=default,gateway.envoyproxy.io/owning-gateway-name=eg -o jsonpath='{.items[0].metadata.name}')Get the deployment of the Envoy service created the by the example Gateway:
export ENVOY_DEPLOYMENT=$(kubectl get deploy -n envoy-gateway-system --selector=gateway.envoyproxy.io/owning-gateway-namespace=default,gateway.envoyproxy.io/owning-gateway-name=eg -o jsonpath='{.items[0].metadata.name}')Port forward to the Envoy service:
kubectl -n envoy-gateway-system port-forward service/${ENVOY_SERVICE} 8888:80 &Curl the example app through Envoy proxy:
curl --verbose --header "Host: www.example.com" http://localhost:8888/getThe above command should succeed with status code 200.
Install Add-ons
Envoy Gateway provides an add-ons Helm chart to simplify the installation of observability components.
The documentation for the add-ons chart can be found
here.
Follow the instructions below to install the add-ons Helm chart.
helm install eg-addons oci://docker.io/envoyproxy/gateway-addons-helm --version v1.7.1 -n monitoring --create-namespace
By default, the OpenTelemetry Collector is disabled. To install add-ons with OpenTelemetry Collector enabled, use the following command.
helm install eg-addons oci://docker.io/envoyproxy/gateway-addons-helm --version v1.7.1 --set opentelemetry-collector.enabled=true -n monitoring --create-namespace
Follow the steps from the Gateway Observability and Proxy Metrics to enable Prometheus metrics for both Envoy Gateway (Control Plane) and Envoy Proxy (Data Plane).
Expose endpoints:
GRAFANA_IP=$(kubectl get svc grafana -n monitoring -o jsonpath='{.status.loadBalancer.ingress[0].ip}')
Connecting Grafana with Prometheus datasource
To visualise metrics from Prometheus, we have to connect Grafana with Prometheus. If you installed Grafana follow the command from prerequisites sections, the Prometheus datasource should be already configured.
You can also add the datasource manually by following the instructions from Grafana Docs.
Accessing Grafana
You can access the Grafana instance by visiting http://{GRAFANA_IP}, derived in prerequisites.
To log in to Grafana, use the credentials admin:admin.
Envoy Gateway has examples of dashboard for you to get started, you can check them out under Dashboards/envoy-gateway.
If you’d like import Grafana dashboards on your own, please refer to Grafana docs for importing dashboards.
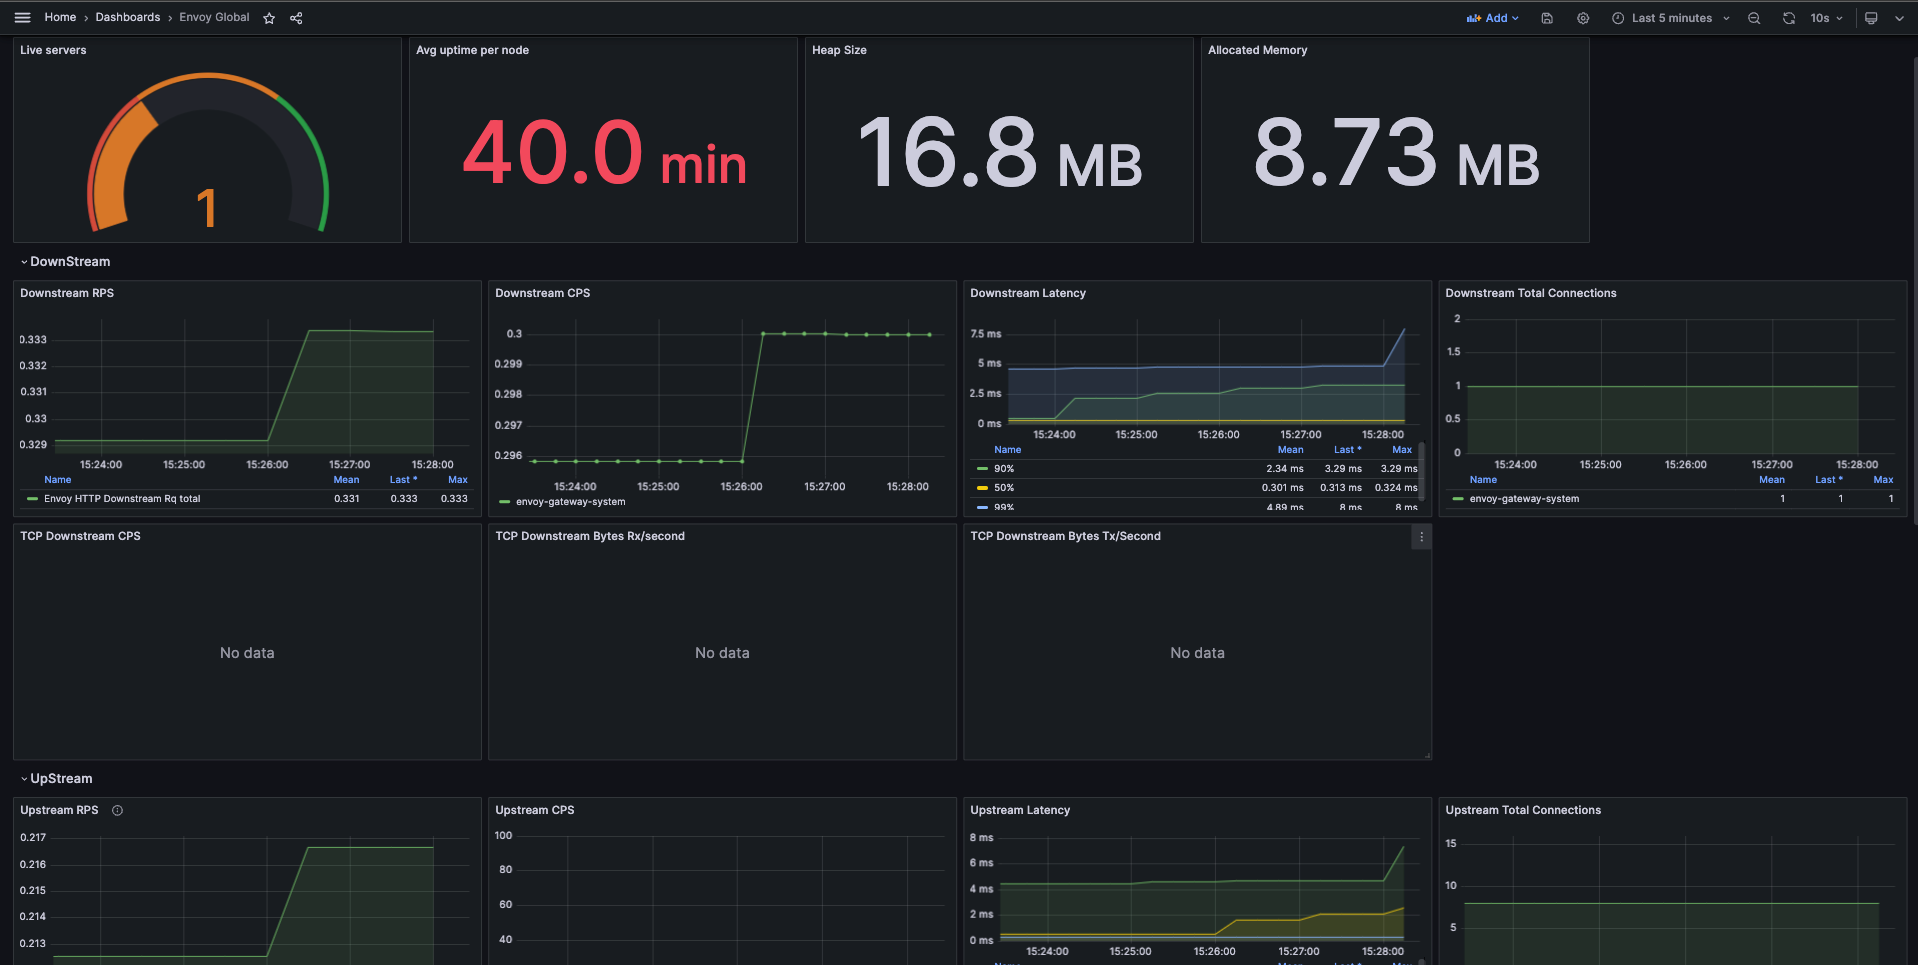
Envoy Proxy Global
This dashboard example shows the overall downstream and upstream stats for each Envoy Proxy instance.
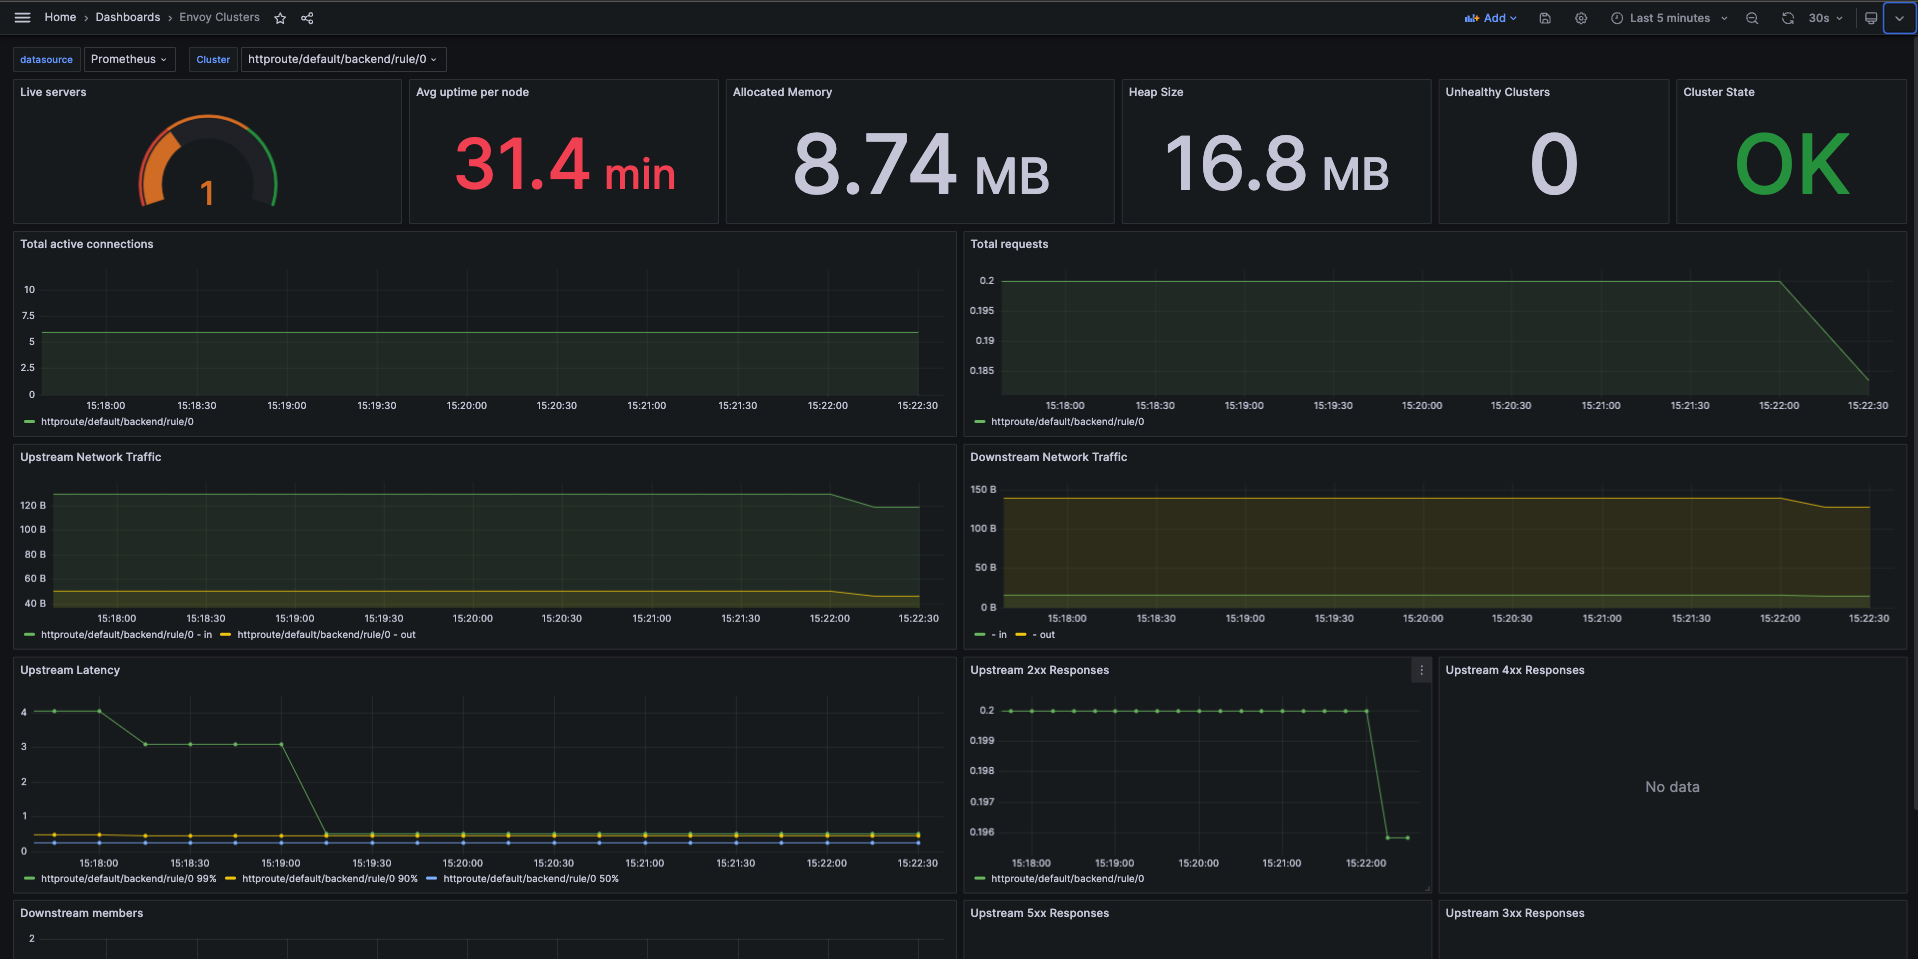
Envoy Clusters
This dashboard example shows the overall stats for each cluster from Envoy Proxy fleet.
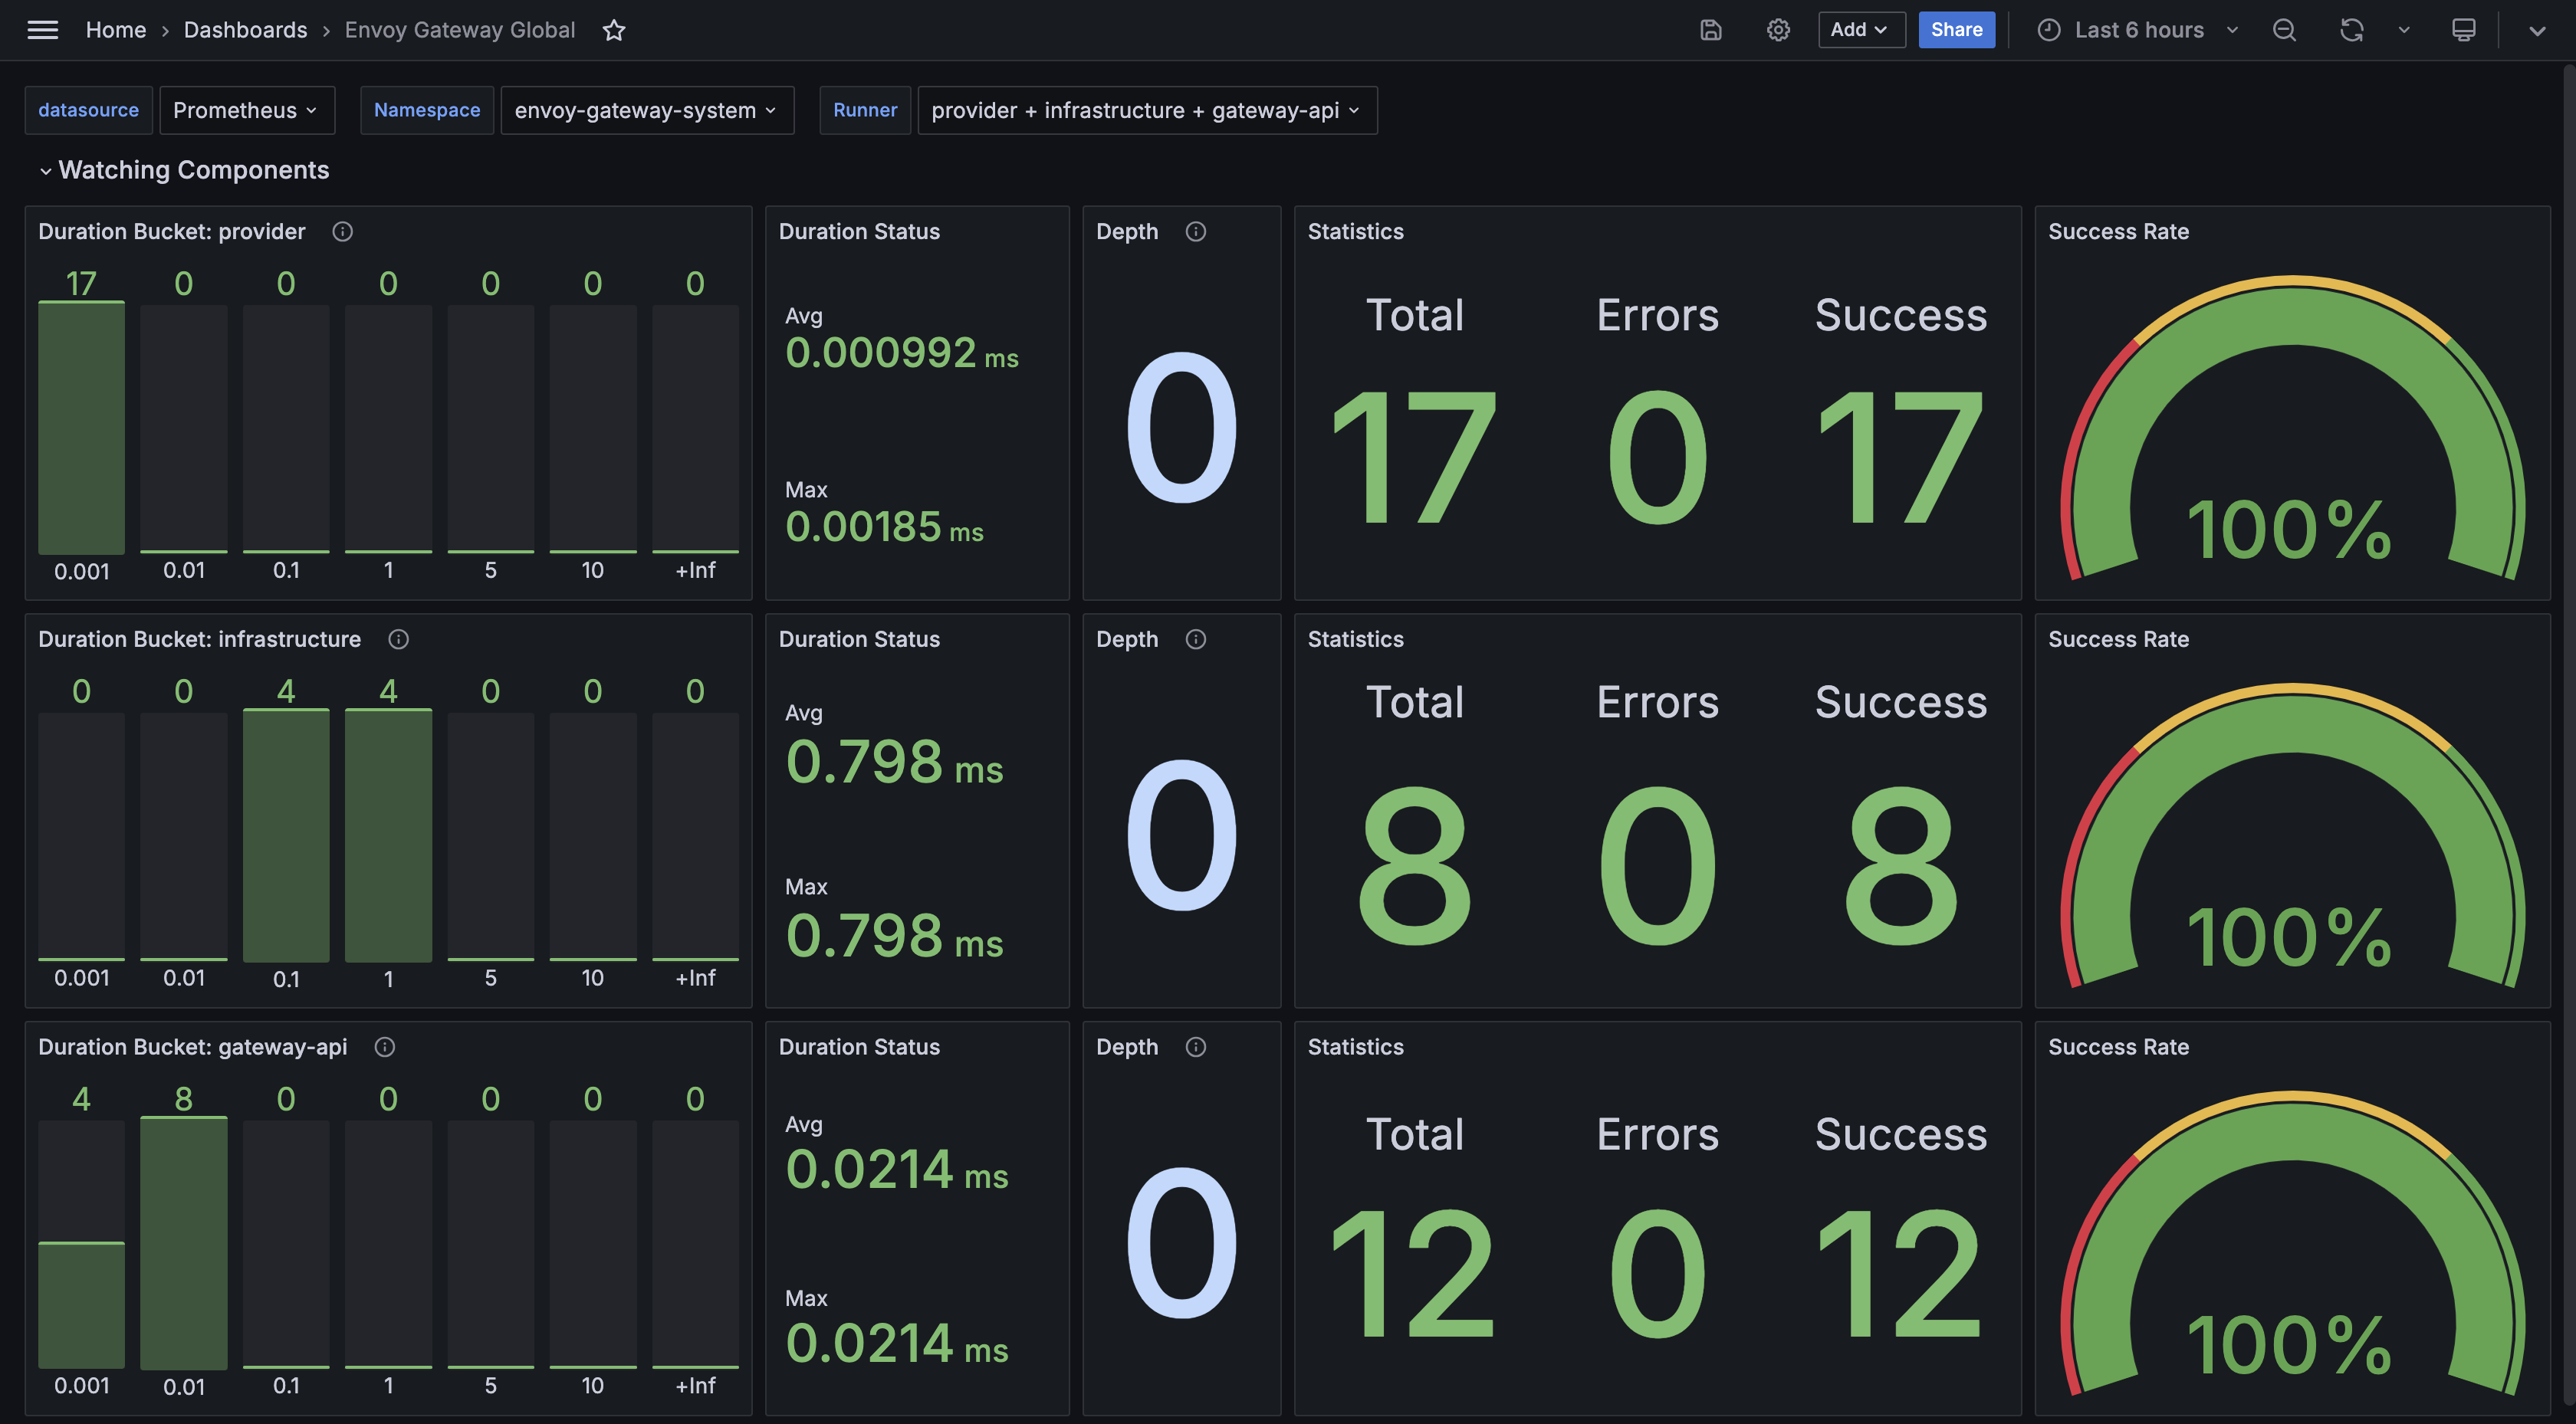
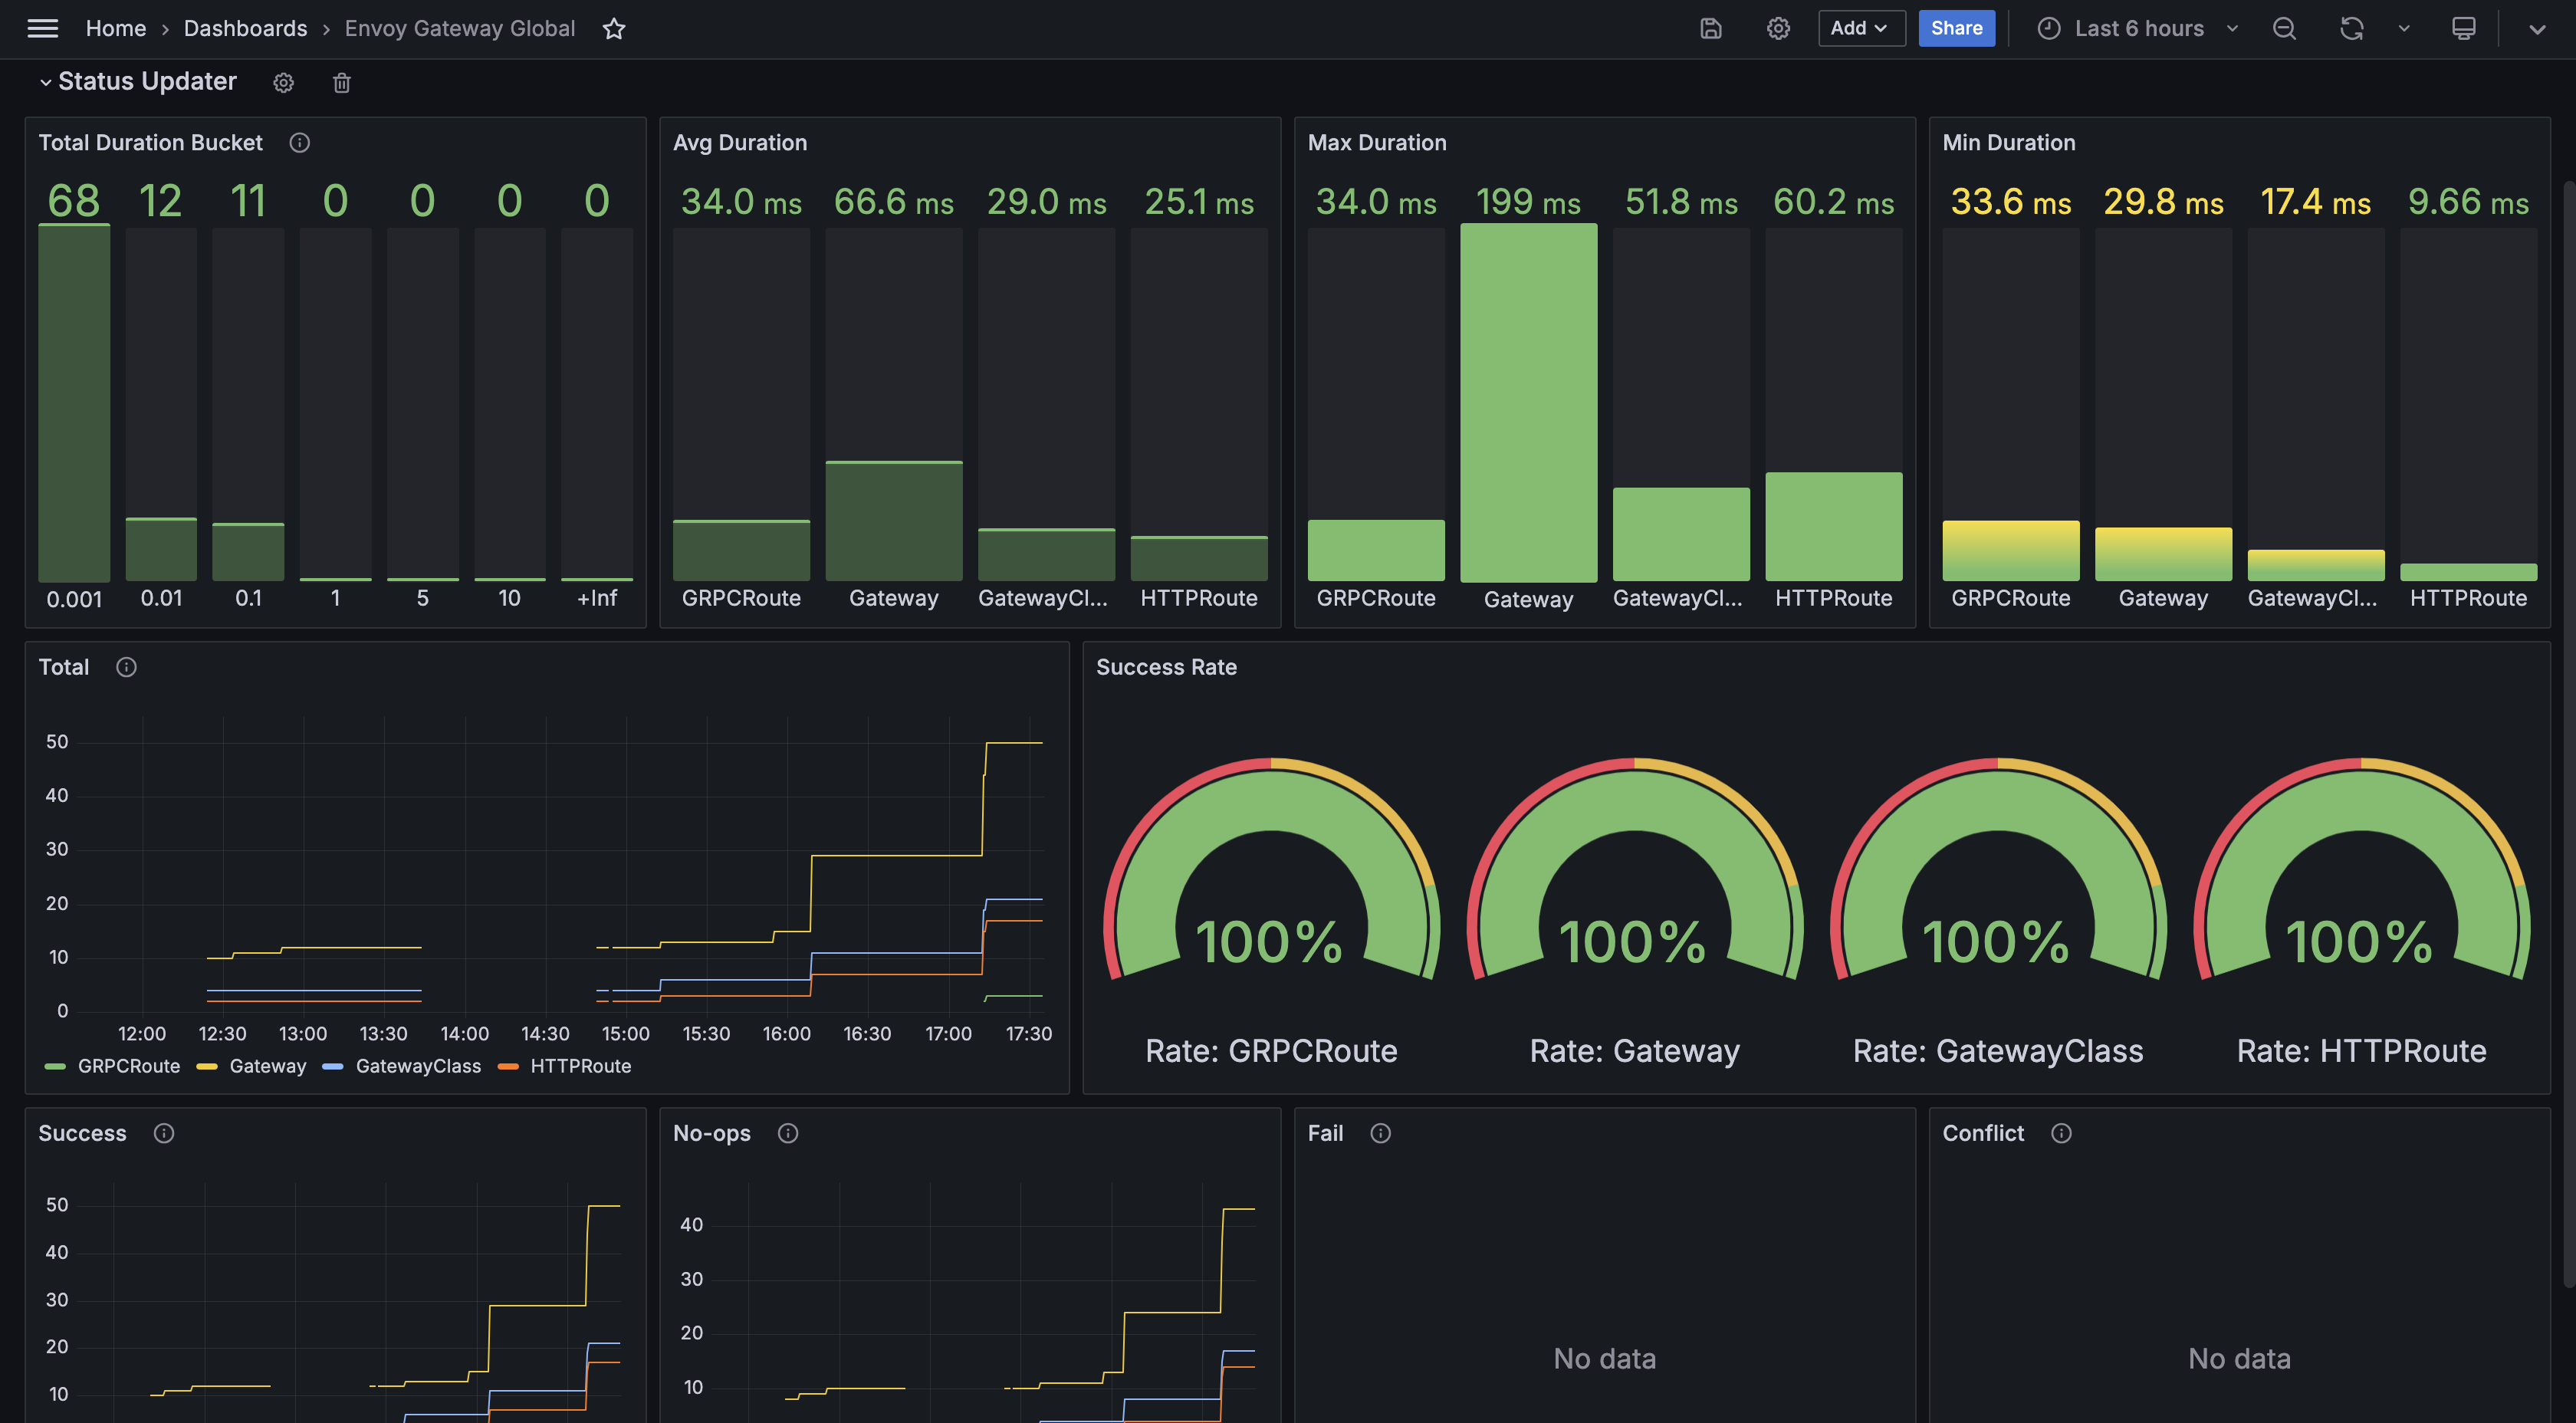
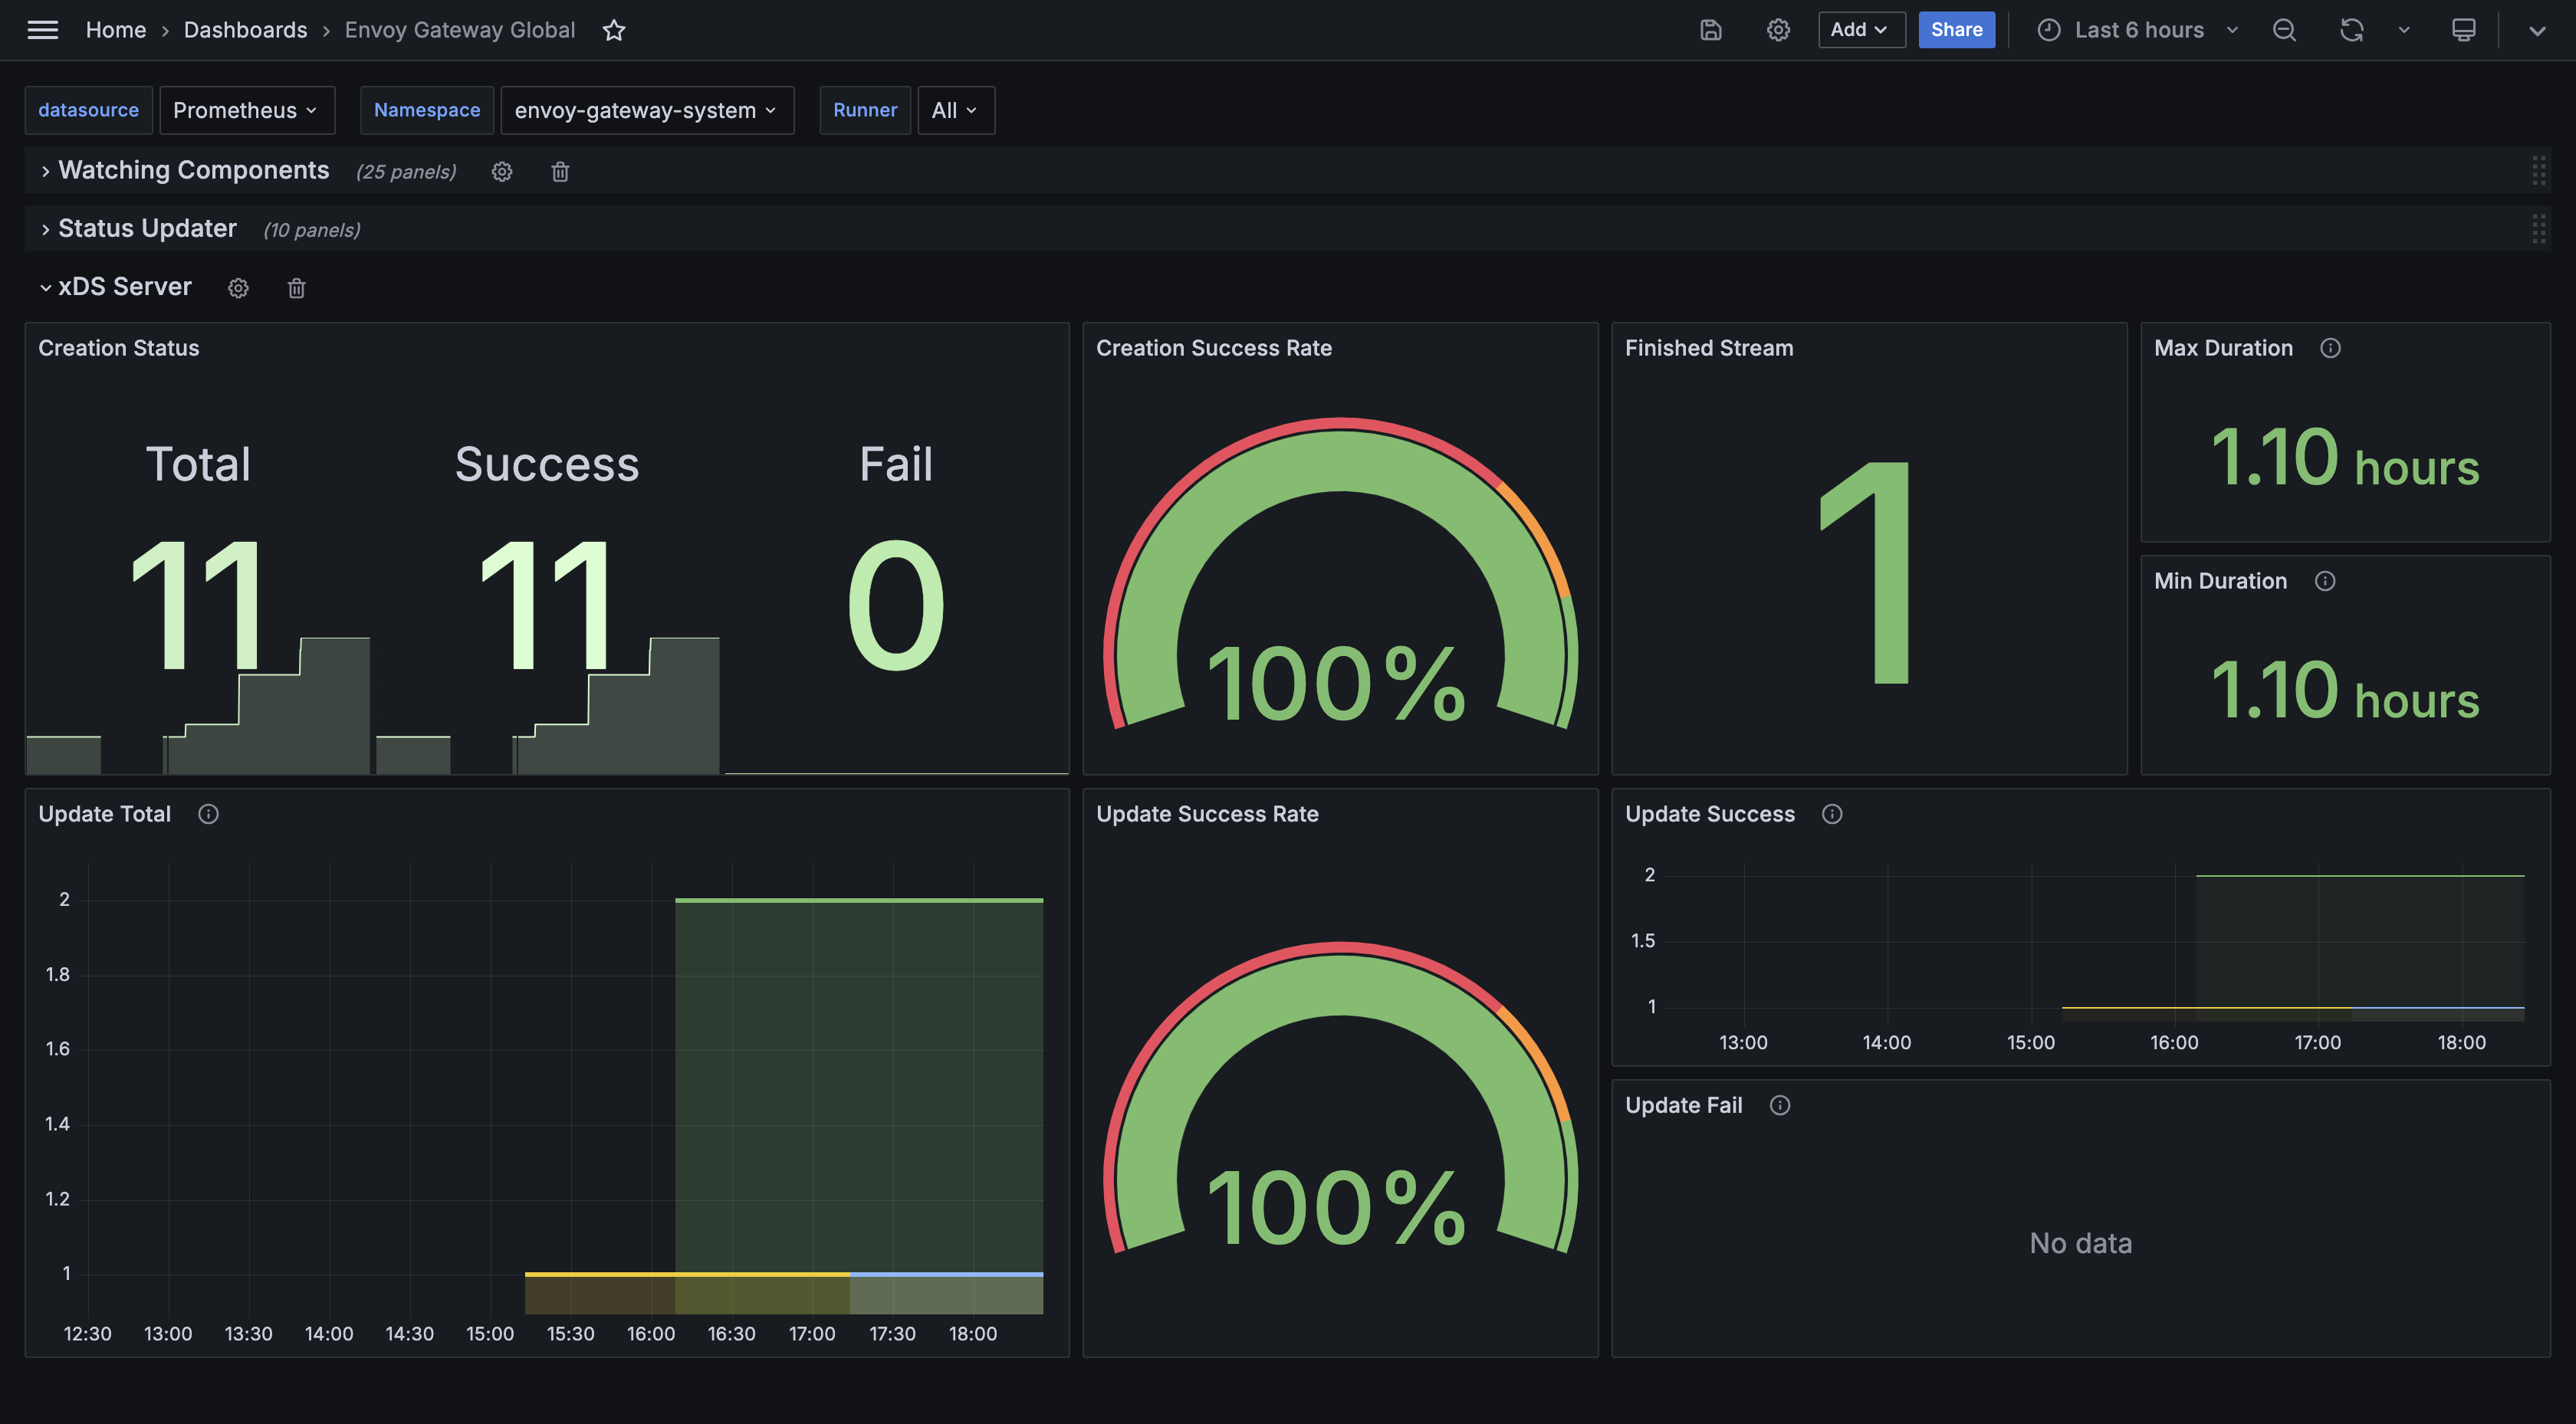
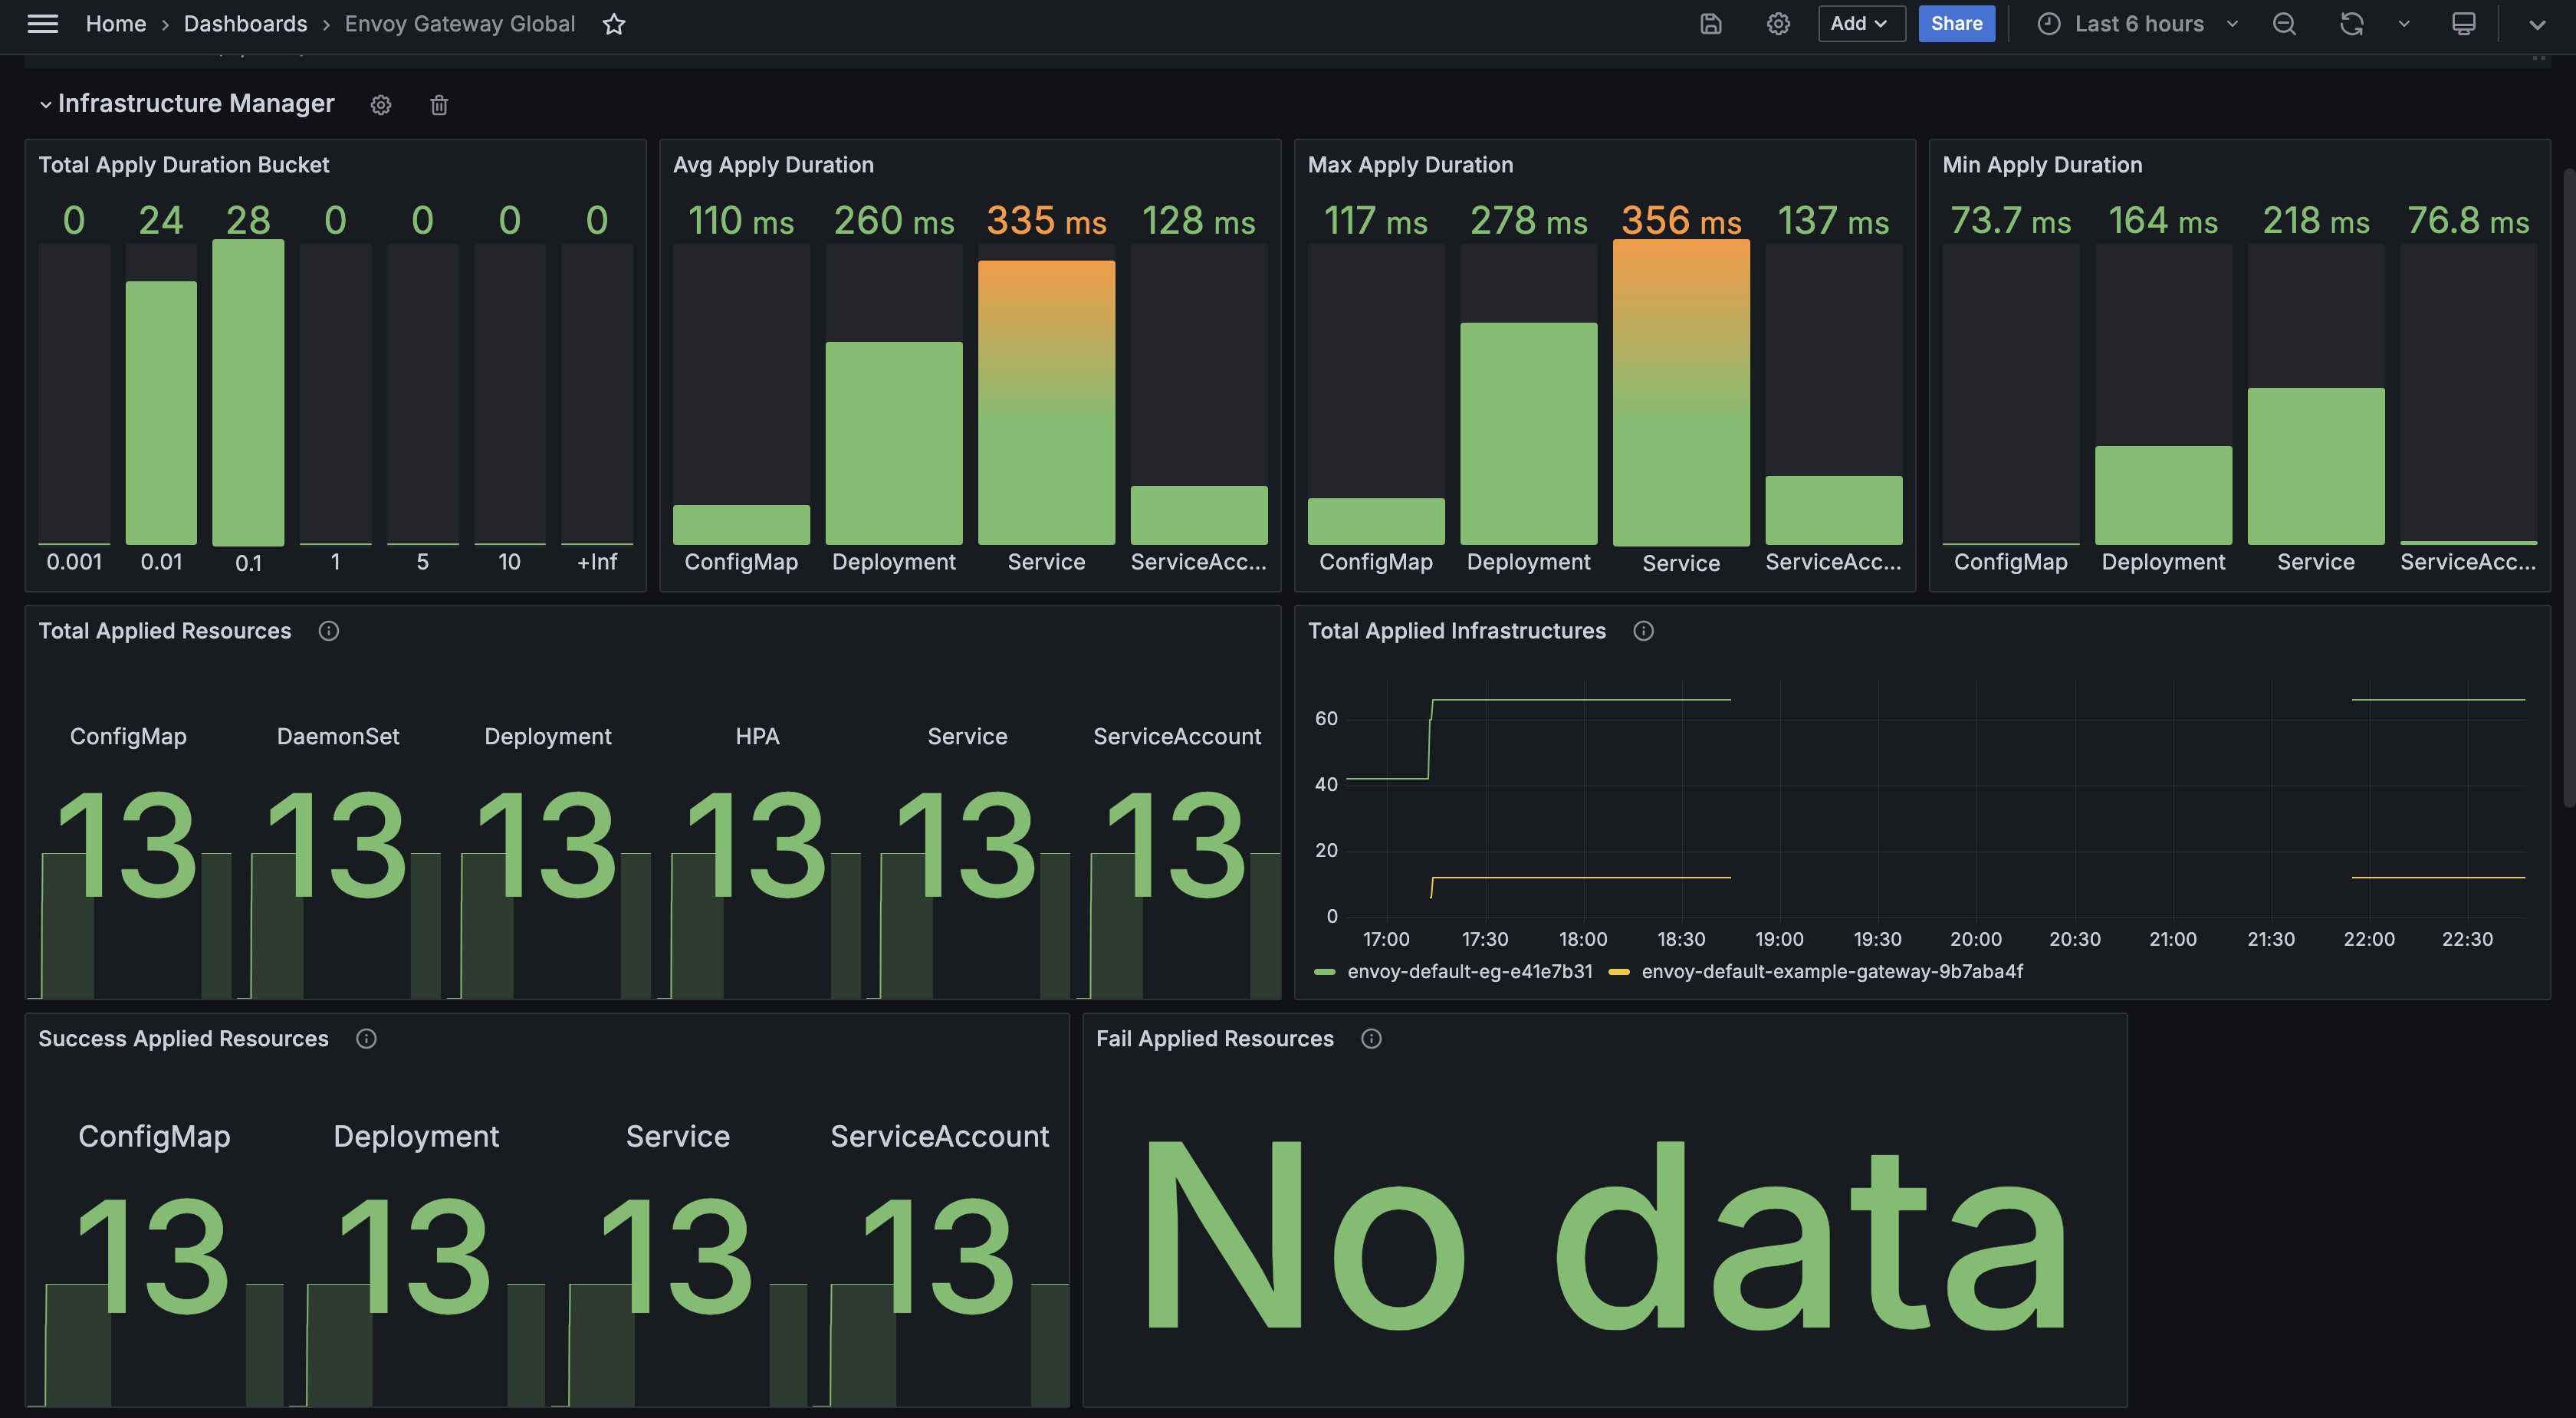
Envoy Gateway Global
This dashboard example shows the overall stats exported by Envoy Gateway fleet.
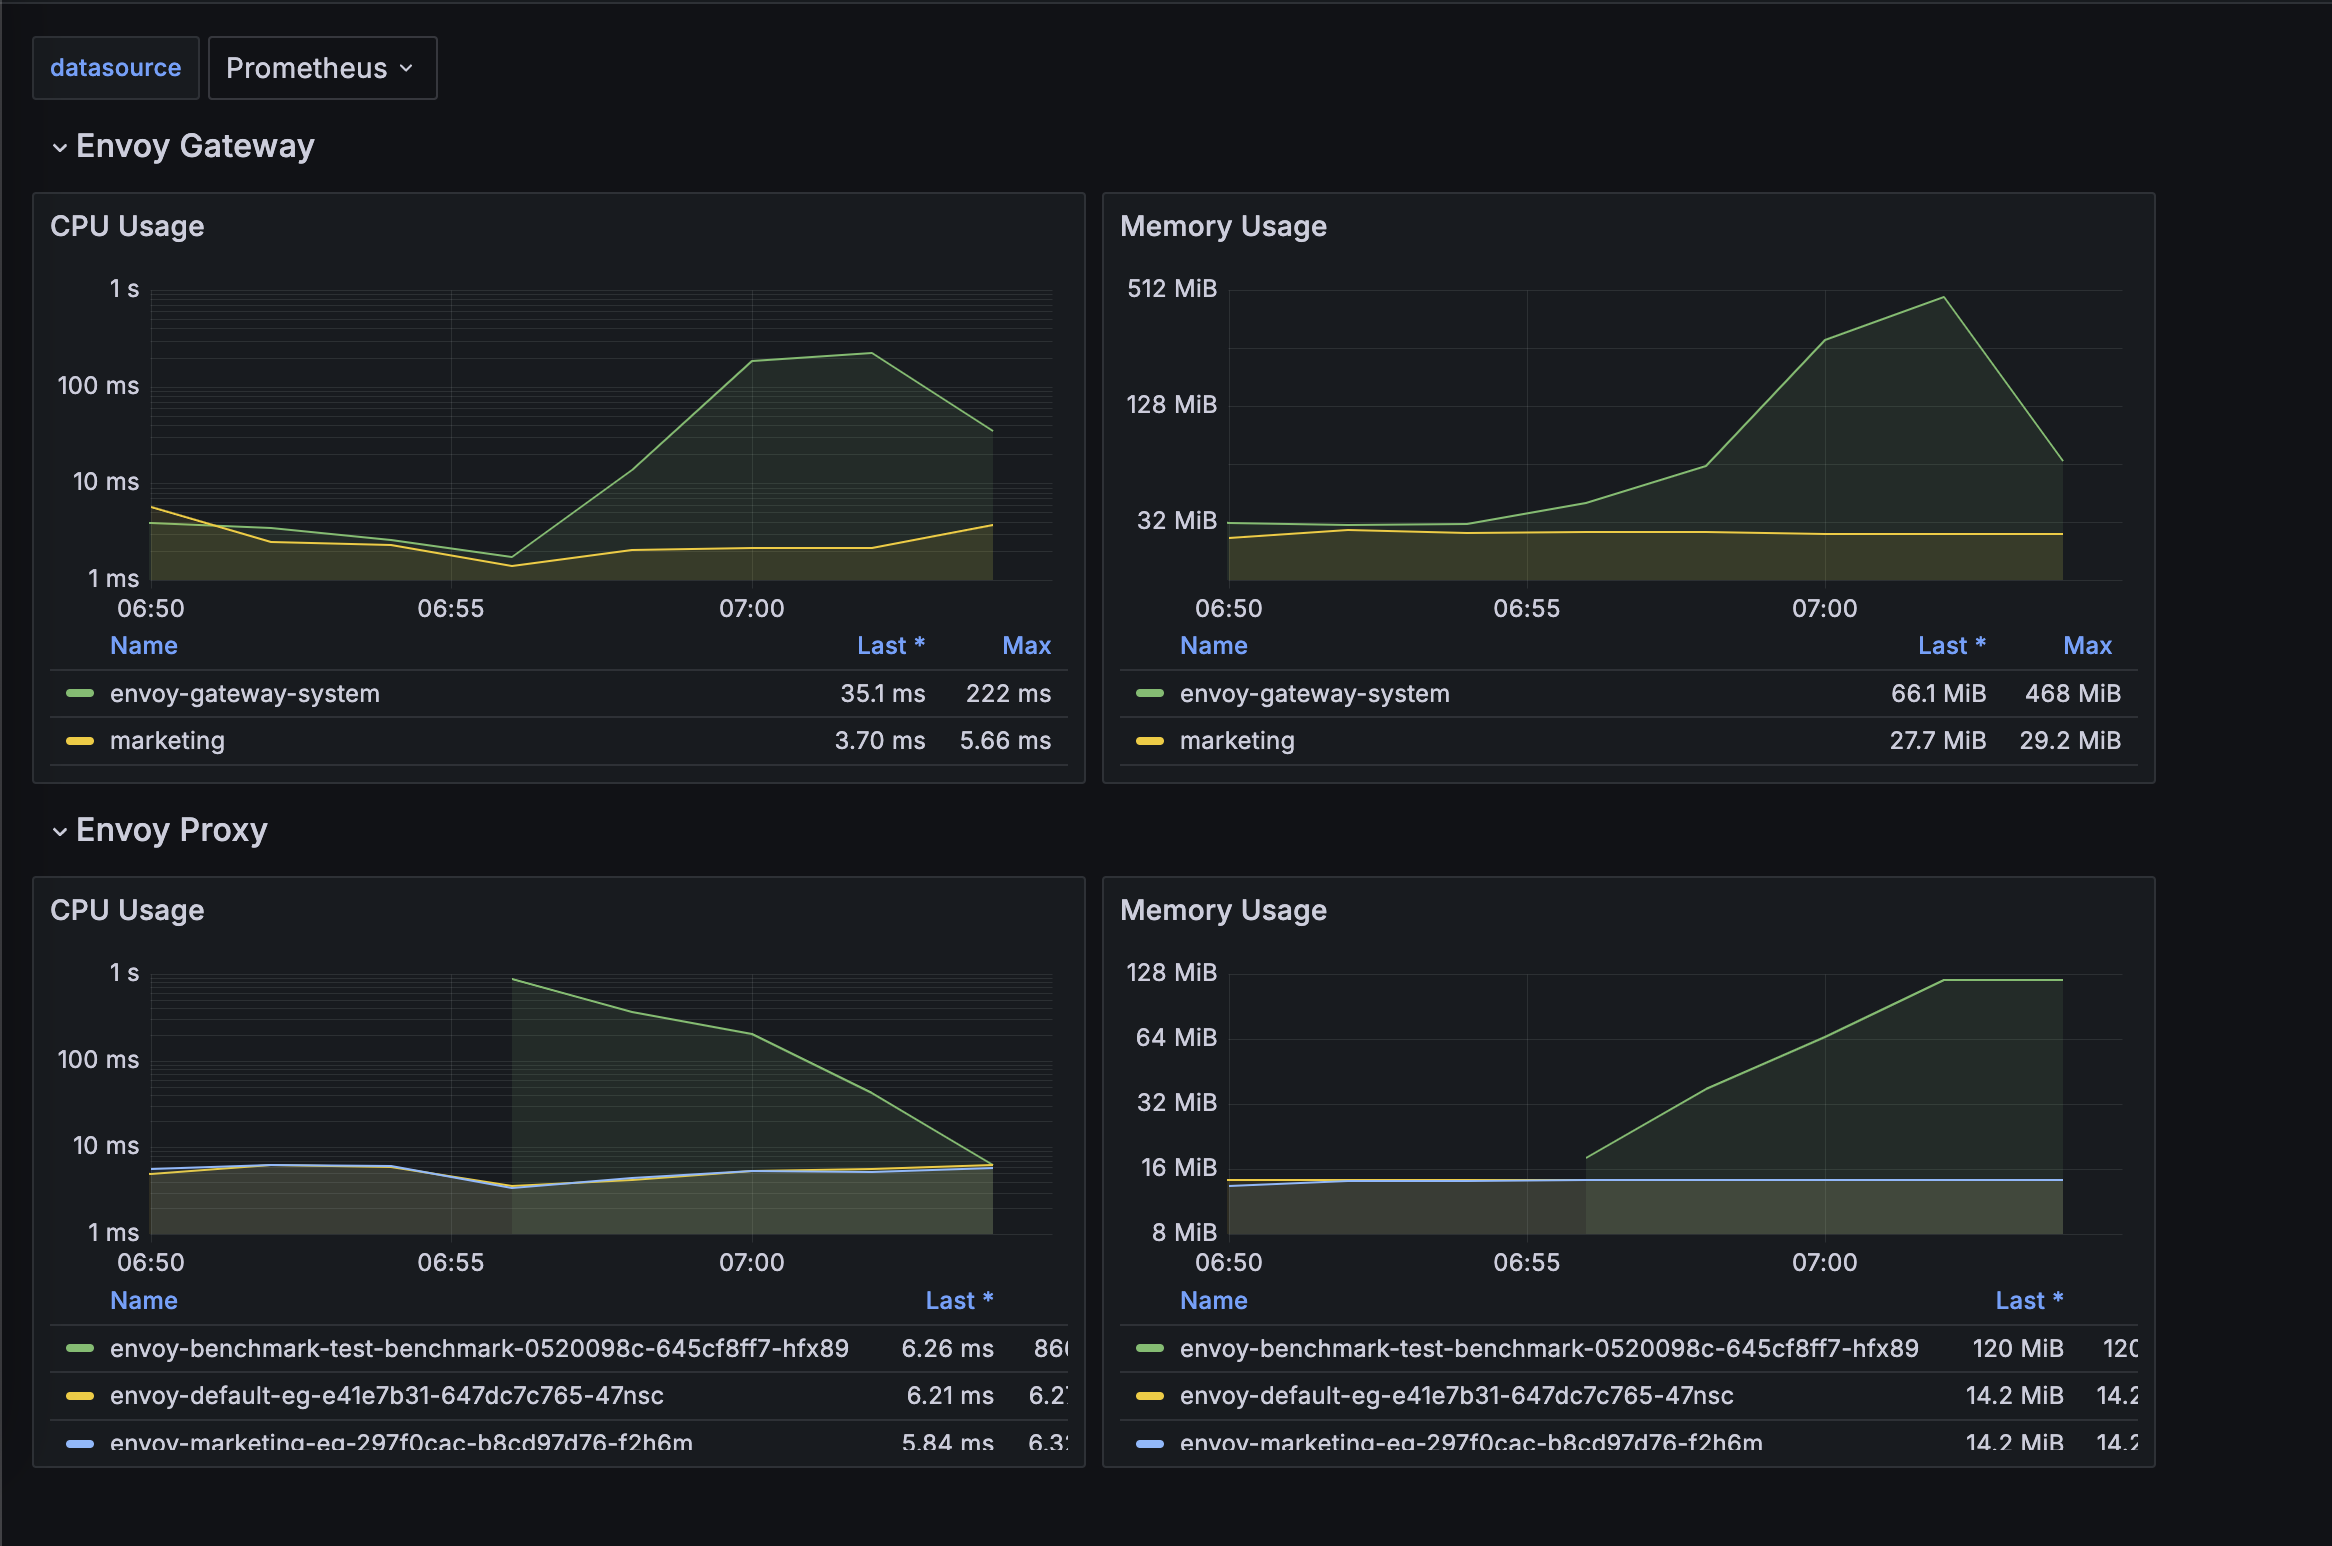
Resources Monitor
This dashboard example shows the overall resources stats for both Envoy Gateway and Envoy Proxy fleet.
Update Dashboards
All dashboards of Envoy Gateway are maintained under charts/gateway-addons-helm/dashboards,
feel free to make contributions.
Grafonnet
Newer dashboards are generated with Jsonnet with the Grafonnet. This is the preferred method for any new dashboards.
You can run make helm-generate.gateway-addons-helm to generate new version of dashboards.
All the generated dashboards have a .gen.json suffix.
Legacy Dashboards
Many of our older dashboards are manually created in the UI and exported as JSON and checked in.
These example dashboards cannot be updated in-place by default, if you are trying to make some changes to the older dashboards, you can save them directly as a JSON file and then re-import.
Feedback
Was this page helpful?
Glad to hear it! Please tell us how we can improve.
Sorry to hear that. Please tell us how we can improve.