This is the multi-page printable view of this section. Click here to print.
Observability
1 - Gateway API Metrics
Prerequisites
Install Envoy Gateway
Follow the steps below to install Envoy Gateway and the example manifest. Before proceeding, you should be able to query the example backend using HTTP.
Expand for instructions
Install the Gateway API CRDs and Envoy Gateway using Helm:
helm install eg oci://docker.io/envoyproxy/gateway-helm --version v1.4.2 -n envoy-gateway-system --create-namespaceInstall the GatewayClass, Gateway, HTTPRoute and example app:
kubectl apply -f https://github.com/envoyproxy/gateway/releases/download/v1.4.2/quickstart.yaml -n defaultVerify Connectivity:
Get the External IP of the Gateway:
export GATEWAY_HOST=$(kubectl get gateway/eg -o jsonpath='{.status.addresses[0].value}')Curl the example app through Envoy proxy:
curl --verbose --header "Host: www.example.com" http://$GATEWAY_HOST/getThe above command should succeed with status code 200.
Get the name of the Envoy service created the by the example Gateway:
export ENVOY_SERVICE=$(kubectl get svc -n envoy-gateway-system --selector=gateway.envoyproxy.io/owning-gateway-namespace=default,gateway.envoyproxy.io/owning-gateway-name=eg -o jsonpath='{.items[0].metadata.name}')Get the deployment of the Envoy service created the by the example Gateway:
export ENVOY_DEPLOYMENT=$(kubectl get deploy -n envoy-gateway-system --selector=gateway.envoyproxy.io/owning-gateway-namespace=default,gateway.envoyproxy.io/owning-gateway-name=eg -o jsonpath='{.items[0].metadata.name}')Port forward to the Envoy service:
kubectl -n envoy-gateway-system port-forward service/${ENVOY_SERVICE} 8888:80 &Curl the example app through Envoy proxy:
curl --verbose --header "Host: www.example.com" http://localhost:8888/getThe above command should succeed with status code 200.
Install Add-ons
Envoy Gateway provides an add-ons Helm chart to simplify the installation of observability components.
The documentation for the add-ons chart can be found
here.
Follow the instructions below to install the add-ons Helm chart.
helm install eg-addons oci://docker.io/envoyproxy/gateway-addons-helm --version v1.4.2 -n monitoring --create-namespace
By default, the OpenTelemetry Collector is disabled. To install add-ons with OpenTelemetry Collector enabled, use the following command.
helm install eg-addons oci://docker.io/envoyproxy/gateway-addons-helm --version v1.4.2 --set opentelemetry-collector.enabled=true -n monitoring --create-namespace
Enable kube-state-metrics
The kube-state-metrics service is required to collect metrics from the Kubernetes API server. Use the following command to enable it:
helm upgrade eg-addons oci://docker.io/envoyproxy/gateway-addons-helm \
--version v1.4.2 \
--reuse-values \
--set prometheus.kube-state-metrics.enabled=true \
-n monitoring
Metrics
To query metrics using Prometheus API, follow the steps below. Make sure to wait for the statefulset to be ready before port-forwarding.
export PROMETHEUS_PORT=$(kubectl get service prometheus -n monitoring -o jsonpath='{.spec.ports[0].port}')
kubectl port-forward service/prometheus -n monitoring 9090:$PROMETHEUS_PORT
The example query below fetches the gatewayapi_gateway_created metric.
Alternatively, access the Prometheus UI at http://localhost:9090.
curl -s 'http://localhost:9090/api/v1/query?query=gatewayapi_gateway_created' | jq .
Alerts
A set of example alert rules are available in config/examples/rules. To create alert use the following command:
cat <<EOF | helm upgrade eg-addons oci://docker.io/envoyproxy/gateway-addons-helm \
  --version v0.0.0-latest \
  -n monitoring --reuse-values -f -
prometheus:
  serverFiles:
    alerting_rules.yml:
      groups:
        - name: gateway-api.rules
          rules:
            - alert: UnhealthyGateway
              expr: (gatewayapi_gateway_status{type="Accepted"} == 0) or (gatewayapi_gateway_status{type="Programmed"} == 0)
              for: 10m
              labels:
                severity: critical
              annotations:
                summary: "Either the Accepted or Programmed status is not True"
                description: "Gateway {{ \$labels.namespace }}/{{ \$labels.name }} has an unhealthy status"
            - alert: InsecureHTTPListener
              expr: gatewayapi_gateway_listener_info{protocol="HTTP"}
              for: 10m
              labels:
                severity: critical
              annotations:
                summary: "Listeners must use HTTPS"
                description: "Gateway {{ \$labels.namespace }}/{{ \$labels.name }} has an insecure listener {{ \$labels.protocol }}/{{ \$labels.port }}"
EOF
To view the alerts, navigate to the Alerts tab at http://localhost:9090/alerts.
Alternatively, you can use the following command to view the alerts via the Prometheus API:
curl -s http://localhost:9090/api/v1/alerts | jq '.data.alerts[]'
Dashboards
To access the Grafana dashboards, follow these steps:
Wait for the deployment to complete, then set up port forwarding using the following commands:
export GRAFANA_PORT=$(kubectl get service grafana -n monitoring -o jsonpath='{.spec.ports[0].port}')
kubectl port-forward service/grafana -n monitoring 3000:$GRAFANA_PORT
Access Grafana by navigating to
http://localhost:3000in your web browserLog in using the default credentials:
- Username:
admin - Password:
admin
- Username:
A set of Grafana dashboards is provided by Gateway API State Metrics. These dashboards are available in ./config/examples/dashboards and on grafana.com. To import them manually navigate to the Grafana UI and select Dashboards > New > Import.
Alternatively, use the following command to import dashboards using the Grafana API:
export GRAFANA_API_KEY="your-api-key"

urls=(
  "https://grafana.com/api/dashboards/19433/revisions/1/download"
  "https://grafana.com/api/dashboards/19432/revisions/1/download"
  "https://grafana.com/api/dashboards/19434/revisions/1/download"
  "https://grafana.com/api/dashboards/19570/revisions/1/download"
)

for url in "${urls[@]}"; do
  dashboard_data=$(curl -s "$url")
  curl -X POST \
    -H "Authorization: Bearer $GRAFANA_API_KEY" \
    -H "Content-Type: application/json" \
    -d "{\"dashboard\": $dashboard_data, \"overwrite\": true}" \
    "http://localhost:3000/api/dashboards/db"
done
Next Steps
Check out the Gateway Exported Metrics section to learn more about the metrics exported by the Envoy Gateway.
2 - Gateway Exported Metrics
The Envoy Gateway provides a collection of self-monitoring metrics in Prometheus format.
These metrics allow monitoring of the behavior of Envoy Gateway itself (as distinct from that of the EnvoyProxy it managed).
EnvoyProxy Metrics
For EnvoyProxy Metrics, please refer to the EnvoyProxy Metrics to learn more.Watching Components
The Resource Provider, xDS Translator and Infra Manager etc. are key components that made up of Envoy Gateway, they all follow the design of Watching Components.
Envoy Gateway collects the following metrics in Watching Components:
| Name | Description |
|---|---|
watchable_depth | Current depth of watchable map. |
watchable_subscribe_duration_seconds | How long in seconds a subscribed watchable queue is handled. |
watchable_subscribe_total | Total number of subscribed watchable queue. |
watchable_panics_recovered_total | Total recovered panics in the watchable infrastructure. |
Each metric includes the runner label to identify the corresponding components,
the relationship between label values and components is as follows:
| Value | Components |
|---|---|
gateway-api | Gateway API Translator |
infrastructure | Infrastructure Manager |
xds-server | xDS Server |
xds-translator | xDS Translator |
global-ratelimit | Global RateLimit xDS Translator |
Metrics may include one or more additional labels, such as message, status and reason etc.
Status Updater
Envoy Gateway monitors the status updates of various resources (like GatewayClass, Gateway and HTTPRoute etc.) through Status Updater.
Envoy Gateway collects the following metrics in Status Updater:
| Name | Description |
|---|---|
status_update_total | Total number of status update by object kind. |
status_update_duration_seconds | How long a status update takes to finish. |
Each metric includes kind label to identify the corresponding resources.
xDS Server
Envoy Gateway monitors the cache and xDS connection status in xDS Server.
Envoy Gateway collects the following metrics in xDS Server:
| Name | Description |
|---|---|
xds_snapshot_create_total | Total number of xds snapshot cache creates. |
xds_snapshot_update_total | Total number of xds snapshot cache updates by node id. |
xds_stream_duration_seconds | How long a xds stream takes to finish. |
- For xDS snapshot cache update and xDS stream connection status, each metric includes
nodeIDlabel to identify the connection peer. - For xDS stream connection status, each metric also includes
streamIDlabel to identify the connection stream, andisDeltaStreamlabel to identify the delta connection stream.
Infrastructure Manager
Envoy Gateway monitors the apply (create or update) and delete operations in Infrastructure Manager.
Envoy Gateway collects the following metrics in Infrastructure Manager:
| Name | Description |
|---|---|
resource_apply_total | Total number of applied resources. |
resource_apply_duration_seconds | How long in seconds a resource be applied successfully. |
resource_delete_total | Total number of deleted resources. |
resource_delete_duration_seconds | How long in seconds a resource be deleted successfully. |
Each metric includes the kind label to identify the corresponding resources being applied or deleted by Infrastructure Manager.
Metrics may also include name and namespace label to identify the name and namespace of corresponding Infrastructure Manager.
Wasm
Envoy Gateway monitors the status of Wasm remote fetch cache.
| Name | Description |
|---|---|
wasm_cache_entries | Number of Wasm remote fetch cache entries. |
wasm_cache_lookup_total | Total number of Wasm remote fetch cache lookups. |
wasm_remote_fetch_total | Total number of Wasm remote fetches and results. |
For metric wasm_cache_lookup_total, we are using hit label (boolean) to indicate whether the Wasm cache has been hit.
Topology Injector MutatingWebhookConfiguration
Envoy Gateway monitors the status of the TopologyInjector webhook which injects node topology information to EnvoyProxy pods.
| Name | Description |
|---|---|
topology_injector_webhook_events_total | Total number of topology injector webhook events. |
This metrics provides information on whether a webhook request was successful, failed, or a no-op.
3 - Gateway Observability
Envoy Gateway provides observability for the ControlPlane and the underlying EnvoyProxy instances. This task show you how to config gateway control-plane observability, includes metrics.
Prerequisites
Install Envoy Gateway
Follow the steps below to install Envoy Gateway and the example manifest. Before proceeding, you should be able to query the example backend using HTTP.
Expand for instructions
Install the Gateway API CRDs and Envoy Gateway using Helm:
helm install eg oci://docker.io/envoyproxy/gateway-helm --version v1.4.2 -n envoy-gateway-system --create-namespaceInstall the GatewayClass, Gateway, HTTPRoute and example app:
kubectl apply -f https://github.com/envoyproxy/gateway/releases/download/v1.4.2/quickstart.yaml -n defaultVerify Connectivity:
Get the External IP of the Gateway:
export GATEWAY_HOST=$(kubectl get gateway/eg -o jsonpath='{.status.addresses[0].value}')Curl the example app through Envoy proxy:
curl --verbose --header "Host: www.example.com" http://$GATEWAY_HOST/getThe above command should succeed with status code 200.
Get the name of the Envoy service created the by the example Gateway:
export ENVOY_SERVICE=$(kubectl get svc -n envoy-gateway-system --selector=gateway.envoyproxy.io/owning-gateway-namespace=default,gateway.envoyproxy.io/owning-gateway-name=eg -o jsonpath='{.items[0].metadata.name}')Get the deployment of the Envoy service created the by the example Gateway:
export ENVOY_DEPLOYMENT=$(kubectl get deploy -n envoy-gateway-system --selector=gateway.envoyproxy.io/owning-gateway-namespace=default,gateway.envoyproxy.io/owning-gateway-name=eg -o jsonpath='{.items[0].metadata.name}')Port forward to the Envoy service:
kubectl -n envoy-gateway-system port-forward service/${ENVOY_SERVICE} 8888:80 &Curl the example app through Envoy proxy:
curl --verbose --header "Host: www.example.com" http://localhost:8888/getThe above command should succeed with status code 200.
Install Add-ons
Envoy Gateway provides an add-ons Helm chart to simplify the installation of observability components.
The documentation for the add-ons chart can be found
here.
Follow the instructions below to install the add-ons Helm chart.
helm install eg-addons oci://docker.io/envoyproxy/gateway-addons-helm --version v1.4.2 -n monitoring --create-namespace
By default, the OpenTelemetry Collector is disabled. To install add-ons with OpenTelemetry Collector enabled, use the following command.
helm install eg-addons oci://docker.io/envoyproxy/gateway-addons-helm --version v1.4.2 --set opentelemetry-collector.enabled=true -n monitoring --create-namespace
Metrics
The default installation of Envoy Gateway installs a default EnvoyGateway configuration and attaches it
using a ConfigMap. In this section, we will update this resource to enable various ways to retrieve metrics
from Envoy Gateway.
Exported Metrics
Refer to the Gateway Exported Metrics List to learn more about Envoy Gateway’s Metrics.Retrieve Prometheus Metrics from Envoy Gateway
By default, prometheus metric is enabled. You can directly retrieve metrics from Envoy Gateway:
export ENVOY_POD_NAME=$(kubectl get pod -n envoy-gateway-system --selector=control-plane=envoy-gateway,app.kubernetes.io/instance=eg -o jsonpath='{.items[0].metadata.name}')
kubectl port-forward pod/$ENVOY_POD_NAME -n envoy-gateway-system 19001:19001

# check metrics
curl localhost:19001/metrics
The following is an example to disable prometheus metric for Envoy Gateway.
cat <<EOF | kubectl apply -f -
apiVersion: v1
kind: ConfigMap
metadata:
  name: envoy-gateway-config
  namespace: envoy-gateway-system
data:
  envoy-gateway.yaml: |
    apiVersion: gateway.envoyproxy.io/v1alpha1
    kind: EnvoyGateway
    provider:
      type: Kubernetes
    gateway:
      controllerName: gateway.envoyproxy.io/gatewayclass-controller
    telemetry:
      metrics:
        prometheus:
          disable: true
EOF
Save and apply the following resource to your cluster:
---
apiVersion: v1
kind: ConfigMap
metadata:
  name: envoy-gateway-config
  namespace: envoy-gateway-system
data:
  envoy-gateway.yaml: |
    apiVersion: gateway.envoyproxy.io/v1alpha1
    kind: EnvoyGateway
    provider:
      type: Kubernetes
    gateway:
      controllerName: gateway.envoyproxy.io/gatewayclass-controller
    telemetry:
      metrics:
        prometheus:
          disable: true
After updating the
ConfigMap, you will need to wait the configuration kicks in.
You can force the configuration to be reloaded by restarting theenvoy-gatewaydeployment.kubectl rollout restart deployment envoy-gateway -n envoy-gateway-system
Enable Open Telemetry sink in Envoy Gateway
The following is an example to send metric via Open Telemetry sink to OTEL gRPC Collector.
cat <<EOF | kubectl apply -f -
apiVersion: v1
kind: ConfigMap
metadata:
  name: envoy-gateway-config
  namespace: envoy-gateway-system
data:
  envoy-gateway.yaml: |
    apiVersion: gateway.envoyproxy.io/v1alpha1
    kind: EnvoyGateway
    provider:
      type: Kubernetes
    gateway:
      controllerName: gateway.envoyproxy.io/gatewayclass-controller
    telemetry:
      metrics:
        sinks:
          - type: OpenTelemetry
            openTelemetry:
              host: otel-collector.monitoring.svc.cluster.local
              port: 4317
              protocol: grpc
EOF
Save and apply the following resource to your cluster:
---
apiVersion: v1
kind: ConfigMap
metadata:
  name: envoy-gateway-config
  namespace: envoy-gateway-system
data:
  envoy-gateway.yaml: |
    apiVersion: gateway.envoyproxy.io/v1alpha1
    kind: EnvoyGateway
    provider:
      type: Kubernetes
    gateway:
      controllerName: gateway.envoyproxy.io/gatewayclass-controller
    telemetry:
      metrics:
        sinks:
          - type: OpenTelemetry
            openTelemetry:
              host: otel-collector.monitoring.svc.cluster.local
              port: 4317
              protocol: grpc
After updating the
ConfigMap, you will need to wait the configuration kicks in.
You can force the configuration to be reloaded by restarting theenvoy-gatewaydeployment.kubectl rollout restart deployment envoy-gateway -n envoy-gateway-system
Verify OTel-Collector metrics:
export OTEL_POD_NAME=$(kubectl get pod -n monitoring --selector=app.kubernetes.io/name=opentelemetry-collector -o jsonpath='{.items[0].metadata.name}')
kubectl port-forward pod/$OTEL_POD_NAME -n monitoring 19001:19001

# check metrics
curl localhost:19001/metrics
4 - Proxy Access Logs
Envoy Gateway provides observability for the ControlPlane and the underlying EnvoyProxy instances. This task show you how to config proxy access logs.
Prerequisites
Install Envoy Gateway
Follow the steps below to install Envoy Gateway and the example manifest. Before proceeding, you should be able to query the example backend using HTTP.
Expand for instructions
Install the Gateway API CRDs and Envoy Gateway using Helm:
helm install eg oci://docker.io/envoyproxy/gateway-helm --version v1.4.2 -n envoy-gateway-system --create-namespaceInstall the GatewayClass, Gateway, HTTPRoute and example app:
kubectl apply -f https://github.com/envoyproxy/gateway/releases/download/v1.4.2/quickstart.yaml -n defaultVerify Connectivity:
Get the External IP of the Gateway:
export GATEWAY_HOST=$(kubectl get gateway/eg -o jsonpath='{.status.addresses[0].value}')Curl the example app through Envoy proxy:
curl --verbose --header "Host: www.example.com" http://$GATEWAY_HOST/getThe above command should succeed with status code 200.
Get the name of the Envoy service created the by the example Gateway:
export ENVOY_SERVICE=$(kubectl get svc -n envoy-gateway-system --selector=gateway.envoyproxy.io/owning-gateway-namespace=default,gateway.envoyproxy.io/owning-gateway-name=eg -o jsonpath='{.items[0].metadata.name}')Get the deployment of the Envoy service created the by the example Gateway:
export ENVOY_DEPLOYMENT=$(kubectl get deploy -n envoy-gateway-system --selector=gateway.envoyproxy.io/owning-gateway-namespace=default,gateway.envoyproxy.io/owning-gateway-name=eg -o jsonpath='{.items[0].metadata.name}')Port forward to the Envoy service:
kubectl -n envoy-gateway-system port-forward service/${ENVOY_SERVICE} 8888:80 &Curl the example app through Envoy proxy:
curl --verbose --header "Host: www.example.com" http://localhost:8888/getThe above command should succeed with status code 200.
Install Add-ons
Envoy Gateway provides an add-ons Helm chart to simplify the installation of observability components.
The documentation for the add-ons chart can be found
here.
Follow the instructions below to install the add-ons Helm chart.
helm install eg-addons oci://docker.io/envoyproxy/gateway-addons-helm --version v1.4.2 -n monitoring --create-namespace
By default, the OpenTelemetry Collector is disabled. To install add-ons with OpenTelemetry Collector enabled, use the following command.
helm install eg-addons oci://docker.io/envoyproxy/gateway-addons-helm --version v1.4.2 --set opentelemetry-collector.enabled=true -n monitoring --create-namespace
By default, the Service type of loki is ClusterIP, you can change it to LoadBalancer type for further usage:
kubectl patch service loki -n monitoring -p '{"spec": {"type": "LoadBalancer"}}'
Expose endpoints:
LOKI_IP=$(kubectl get svc loki -n monitoring -o jsonpath='{.status.loadBalancer.ingress[0].ip}')
Default Access Log
If custom format string is not specified, Envoy Gateway uses the following default format:
{
  "start_time": "%START_TIME%",
  "method": "%REQ(:METHOD)%",
  "x-envoy-origin-path": "%REQ(X-ENVOY-ORIGINAL-PATH?:PATH)%",
  "protocol": "%PROTOCOL%",
  "response_code": "%RESPONSE_CODE%",
  "response_flags": "%RESPONSE_FLAGS%",
  "response_code_details": "%RESPONSE_CODE_DETAILS%",
  "connection_termination_details": "%CONNECTION_TERMINATION_DETAILS%",
  "upstream_transport_failure_reason": "%UPSTREAM_TRANSPORT_FAILURE_REASON%",
  "bytes_received": "%BYTES_RECEIVED%",
  "bytes_sent": "%BYTES_SENT%",
  "duration": "%DURATION%",
  "x-envoy-upstream-service-time": "%RESP(X-ENVOY-UPSTREAM-SERVICE-TIME)%",
  "x-forwarded-for": "%REQ(X-FORWARDED-FOR)%",
  "user-agent": "%REQ(USER-AGENT)%",
  "x-request-id": "%REQ(X-REQUEST-ID)%",
  ":authority": "%REQ(:AUTHORITY)%",
  "upstream_host": "%UPSTREAM_HOST%",
  "upstream_cluster": "%UPSTREAM_CLUSTER%",
  "upstream_local_address": "%UPSTREAM_LOCAL_ADDRESS%",
  "downstream_local_address": "%DOWNSTREAM_LOCAL_ADDRESS%",
  "downstream_remote_address": "%DOWNSTREAM_REMOTE_ADDRESS%",
  "requested_server_name": "%REQUESTED_SERVER_NAME%",
  "route_name": "%ROUTE_NAME%"
}
Note: Envoy Gateway disable envoy headers by default, you can enable it by setting
EnableEnvoyHeaderstotruein the ClientTrafficPolicy CRD.
Verify logs from loki:
curl -s "http://$LOKI_IP:3100/loki/api/v1/query_range" --data-urlencode "query={job=\"fluentbit\"}" | jq '.data.result[0].values'
Disable Access Log
If you want to disable it, set the telemetry.accesslog.disable to true in the EnvoyProxy CRD.
kubectl apply -f - <<EOF
apiVersion: gateway.networking.k8s.io/v1
kind: GatewayClass
metadata:
  name: eg
spec:
  controllerName: gateway.envoyproxy.io/gatewayclass-controller
  parametersRef:
    group: gateway.envoyproxy.io
    kind: EnvoyProxy
    name: disable-accesslog
    namespace: envoy-gateway-system
---
apiVersion: gateway.envoyproxy.io/v1alpha1
kind: EnvoyProxy
metadata:
  name: disable-accesslog
  namespace: envoy-gateway-system
spec:
  telemetry:
    accessLog:
      disable: true
EOF
OpenTelemetry Sink
Envoy Gateway can send logs to OpenTelemetry Sink.
kubectl apply -f - <<EOF
apiVersion: gateway.networking.k8s.io/v1
kind: GatewayClass
metadata:
  name: eg
spec:
  controllerName: gateway.envoyproxy.io/gatewayclass-controller
  parametersRef:
    group: gateway.envoyproxy.io
    kind: EnvoyProxy
    name: otel-access-logging
    namespace: envoy-gateway-system
---
apiVersion: gateway.envoyproxy.io/v1alpha1
kind: EnvoyProxy
metadata:
  name: otel-access-logging
  namespace: envoy-gateway-system
spec:
  telemetry:
    accessLog:
      settings:
        - format:
            type: Text
            text: |
              [%START_TIME%] "%REQ(:METHOD)% %REQ(X-ENVOY-ORIGINAL-PATH?:PATH)% %PROTOCOL%" %RESPONSE_CODE% %RESPONSE_FLAGS% %BYTES_RECEIVED% %BYTES_SENT% %DURATION% "%REQ(X-FORWARDED-FOR)%" "%REQ(USER-AGENT)%" "%REQ(X-REQUEST-ID)%" "%REQ(:AUTHORITY)%" "%UPSTREAM_HOST%"
          sinks:
            - type: OpenTelemetry
              openTelemetry:
                host: otel-collector.monitoring.svc.cluster.local
                port: 4317
                resources:
                  k8s.cluster.name: "cluster-1"
EOF
Verify logs from loki:
curl -s "http://$LOKI_IP:3100/loki/api/v1/query_range" --data-urlencode "query={exporter=\"OTLP\"}" | jq '.data.result[0].values'
gGRPC Access Log Service(ALS) Sink
Envoy Gateway can send logs to a backend implemented gRPC access log service proto. There’s an example service here, which simply count the log and export to prometheus endpoint.
The following configuration sends logs to the gRPC access log service:
kubectl apply -f - <<EOF
apiVersion: gateway.networking.k8s.io/v1
kind: GatewayClass
metadata:
  name: eg
spec:
  controllerName: gateway.envoyproxy.io/gatewayclass-controller
  parametersRef:
    group: gateway.envoyproxy.io
    kind: EnvoyProxy
    name: als
    namespace: envoy-gateway-system
---
apiVersion: gateway.envoyproxy.io/v1alpha1
kind: EnvoyProxy
metadata:
  name: als
  namespace: envoy-gateway-system
spec:
  telemetry:
    accessLog:
      settings:
        - sinks:
            - type: ALS
              als:
                backendRefs:
                  - name: otel-collector
                    namespace: monitoring
                    port: 9000
                type: HTTP
EOF
Verify logs from envoy-als:
curl -s "http://$LOKI_IP:3100/loki/api/v1/query_range" --data-urlencode "query={exporter=\"OTLP\"}" | jq '.data.result[0].values'
CEL Expressions
Envoy Gateway provides CEL expressions to filter access log .
For example, you can use the expression 'x-envoy-logged' in request.headers to filter logs that contain the x-envoy-logged header.
kubectl apply -f - <<EOF
apiVersion: gateway.networking.k8s.io/v1
kind: GatewayClass
metadata:
  name: eg
spec:
  controllerName: gateway.envoyproxy.io/gatewayclass-controller
  parametersRef:
    group: gateway.envoyproxy.io
    kind: EnvoyProxy
    name: otel-access-logging
    namespace: envoy-gateway-system
---
apiVersion: gateway.envoyproxy.io/v1alpha1
kind: EnvoyProxy
metadata:
  name: otel-access-logging
  namespace: envoy-gateway-system
spec:
  telemetry:
    accessLog:
      settings:
        - format:
            type: Text
            text: |
              [%START_TIME%] "%REQ(:METHOD)% %REQ(X-ENVOY-ORIGINAL-PATH?:PATH)% %PROTOCOL%" %RESPONSE_CODE% %RESPONSE_FLAGS% %BYTES_RECEIVED% %BYTES_SENT% %DURATION% "%REQ(X-FORWARDED-FOR)%" "%REQ(USER-AGENT)%" "%REQ(X-REQUEST-ID)%" "%REQ(:AUTHORITY)%" "%UPSTREAM_HOST%"
          matches:
            - "'x-envoy-logged' in request.headers"
          sinks:
            - type: OpenTelemetry
              openTelemetry:
                host: otel-collector.monitoring.svc.cluster.local
                port: 4317
                resources:
                  k8s.cluster.name: "cluster-1"
EOF
Verify logs from loki:
curl -s "http://$LOKI_IP:3100/loki/api/v1/query_range" --data-urlencode "query={exporter=\"OTLP\"}" | jq '.data.result[0].values'
Additional Metadata
Envoy Gateway provides additional metadata about the K8s resources that were translated to certain envoy resources.
For example, details about the HTTPRoute and GRPCRoute (kind, group, name, namespace and annotations) are available
for access log formatter using the METADATA operator. To enrich logs, users can add log operator such as:
%METADATA(ROUTE:envoy-gateway:resources)% to their access log format.
Access Log Types
By default, Access Log settings would apply to:
- All Routes
- If traffic is not matched by any Route known to Envoy, the Listener would emit the access log instead
Users may wish to customize this behavior:
- Emit Access Logs by all Listeners for all traffic with specific settings
- Do not emit Route-oriented access logs when a route is not matched.
To achieve this, users can select if Access Log settings follow the default behavior or apply specifically to Routes or Listeners by specifying the setting’s type.
Note: When users define their own Access Log settings (with or without a type), the default Envoy Gateway file access log is no longer configured. It can be re-enabled explicitly by adding empty settings for the desired components.
In the following example:
- Route Access logs would use the default Envoy Gateway format and sink
- Listener Access logs are customized to report transport-level failures and connection attributes
kubectl apply -f - <<EOF
apiVersion: gateway.networking.k8s.io/v1
kind: GatewayClass
metadata:
  name: eg
spec:
  controllerName: gateway.envoyproxy.io/gatewayclass-controller
  parametersRef:
    group: gateway.envoyproxy.io
    kind: EnvoyProxy
    name: otel-access-logging
    namespace: envoy-gateway-system
---
apiVersion: gateway.envoyproxy.io/v1alpha1
kind: EnvoyProxy
metadata:
  name: otel-access-logging
  namespace: envoy-gateway-system
spec:
  telemetry:
    accessLog:
      settings:
        - type: Route # re-enable default access log for route
        - type: Listener # configure specific access log for listeners
          format:
            type: Text
            text: |
              [%START_TIME%] %DOWNSTREAM_REMOTE_ADDRESS% %RESPONSE_FLAGS% %BYTES_RECEIVED% %BYTES_SENT% %DOWNSTREAM_TRANSPORT_FAILURE_REASON%
          sinks:
            - type: OpenTelemetry
              openTelemetry:
                host: otel-collector.monitoring.svc.cluster.local
                port: 4317
                resources:
                  k8s.cluster.name: "cluster-1"
EOF
5 - Proxy Metrics
Envoy Gateway offers observability for both the Control Plane and the underlying Envoy Proxy instances. This task shows you how to configure proxy metrics.
Prerequisites
Install Envoy Gateway
Follow the steps below to install Envoy Gateway and the example manifest. Before proceeding, you should be able to query the example backend using HTTP.
Expand for instructions
Install the Gateway API CRDs and Envoy Gateway using Helm:
helm install eg oci://docker.io/envoyproxy/gateway-helm --version v1.4.2 -n envoy-gateway-system --create-namespaceInstall the GatewayClass, Gateway, HTTPRoute and example app:
kubectl apply -f https://github.com/envoyproxy/gateway/releases/download/v1.4.2/quickstart.yaml -n defaultVerify Connectivity:
Get the External IP of the Gateway:
export GATEWAY_HOST=$(kubectl get gateway/eg -o jsonpath='{.status.addresses[0].value}')Curl the example app through Envoy proxy:
curl --verbose --header "Host: www.example.com" http://$GATEWAY_HOST/getThe above command should succeed with status code 200.
Get the name of the Envoy service created the by the example Gateway:
export ENVOY_SERVICE=$(kubectl get svc -n envoy-gateway-system --selector=gateway.envoyproxy.io/owning-gateway-namespace=default,gateway.envoyproxy.io/owning-gateway-name=eg -o jsonpath='{.items[0].metadata.name}')Get the deployment of the Envoy service created the by the example Gateway:
export ENVOY_DEPLOYMENT=$(kubectl get deploy -n envoy-gateway-system --selector=gateway.envoyproxy.io/owning-gateway-namespace=default,gateway.envoyproxy.io/owning-gateway-name=eg -o jsonpath='{.items[0].metadata.name}')Port forward to the Envoy service:
kubectl -n envoy-gateway-system port-forward service/${ENVOY_SERVICE} 8888:80 &Curl the example app through Envoy proxy:
curl --verbose --header "Host: www.example.com" http://localhost:8888/getThe above command should succeed with status code 200.
Install Add-ons
Envoy Gateway provides an add-ons Helm chart to simplify the installation of observability components.
The documentation for the add-ons chart can be found
here.
Follow the instructions below to install the add-ons Helm chart.
helm install eg-addons oci://docker.io/envoyproxy/gateway-addons-helm --version v1.4.2 -n monitoring --create-namespace
By default, the OpenTelemetry Collector is disabled. To install add-ons with OpenTelemetry Collector enabled, use the following command.
helm install eg-addons oci://docker.io/envoyproxy/gateway-addons-helm --version v1.4.2 --set opentelemetry-collector.enabled=true -n monitoring --create-namespace
Metrics
Prometheus Metrics
To query metrics using Prometheus API, follow the steps below.
export PROMETHEUS_PORT=$(kubectl get service prometheus -n monitoring -o jsonpath='{.spec.ports[0].port}')
kubectl port-forward service/prometheus -n monitoring 19001:$PROMETHEUS_PORT
Query metrics using Prometheus API:
curl -s 'http://localhost:19001/api/v1/query?query=topk(1,envoy_cluster_upstream_cx_connect_ms_sum)' | jq .
To directly view the metrics in Prometheus format from the Envoy’s /stats/prometheus
admin endpoint, follow the steps below.
export ENVOY_POD_NAME=$(kubectl get pod -n envoy-gateway-system --selector=gateway.envoyproxy.io/owning-gateway-namespace=default,gateway.envoyproxy.io/owning-gateway-name=eg -o jsonpath='{.items[0].metadata.name}')
kubectl port-forward pod/$ENVOY_POD_NAME -n envoy-gateway-system 19001:19001
View the metrics:
curl localhost:19001/stats/prometheus | grep "default/backend/rule/0"
If you are only using the OpenTelemetry sink, you might want to set the telemetry.metrics.prometheus.disable to true
in the EnvoyProxy CRD as shown in the following command.
cat <<EOF | kubectl apply -f -
apiVersion: gateway.networking.k8s.io/v1
kind: Gateway
metadata:
  name: eg
  namespace: envoy-gateway-system
spec:
  gatewayClassName: eg
  infrastructure:
    parametersRef:
      group: gateway.envoyproxy.io
      kind: EnvoyProxy
      name: prometheus
  listeners:
    - name: http
      protocol: HTTP
      port: 80
---
apiVersion: gateway.envoyproxy.io/v1alpha1
kind: EnvoyProxy
metadata:
  name: prometheus
  namespace: envoy-gateway-system
spec:
  telemetry:
    metrics:
      prometheus:
        disable: true
EOF
apiVersion: gateway.networking.k8s.io/v1
kind: Gateway
metadata:
  name: eg
  namespace: envoy-gateway-system
spec:
  gatewayClassName: eg
  infrastructure:
    parametersRef:
      group: gateway.envoyproxy.io
      kind: EnvoyProxy
      name: prometheus
  listeners:
    - name: http
      protocol: HTTP
      port: 80
---
apiVersion: gateway.envoyproxy.io/v1alpha1
kind: EnvoyProxy
metadata:
  name: prometheus
  namespace: envoy-gateway-system
spec:
  telemetry:
    metrics:
      prometheus:
        disable: true
To completely remove Prometheus resources from the cluster, set the prometheus.enabled Helm value to false.
helm upgrade eg-addons oci://docker.io/envoyproxy/gateway-addons-helm --version v1.4.2 -n monitoring --reuse-values --set prometheus.enabled=false
OpenTelemetry Metrics
Envoy Gateway can export metrics to an OpenTelemetry sink. Use the following command to send metrics to the OpenTelemetry Collector. Ensure that the OpenTelemetry components are enabled, as mentioned in the Prerequisites.
cat <<EOF | kubectl apply -f -
apiVersion: gateway.networking.k8s.io/v1
kind: Gateway
metadata:
  name: eg
  namespace: envoy-gateway-system
spec:
  gatewayClassName: eg
  infrastructure:
    parametersRef:
      group: gateway.envoyproxy.io
      kind: EnvoyProxy
      name: otel-sink
  listeners:
    - name: http
      protocol: HTTP
      port: 80
---
apiVersion: gateway.envoyproxy.io/v1alpha1
kind: EnvoyProxy
metadata:
  name: otel-sink
  namespace: envoy-gateway-system
spec:
  telemetry:
    metrics:
      sinks:
        - type: OpenTelemetry
          openTelemetry:
            host: otel-collector.monitoring.svc.cluster.local
            port: 4317
EOF
apiVersion: gateway.networking.k8s.io/v1
kind: Gateway
metadata:
  name: eg
  namespace: envoy-gateway-system
spec:
  gatewayClassName: eg
  infrastructure:
    parametersRef:
      group: gateway.envoyproxy.io
      kind: EnvoyProxy
      name: otel-sink
  listeners:
    - name: http
      protocol: HTTP
      port: 80
---
apiVersion: gateway.envoyproxy.io/v1alpha1
kind: EnvoyProxy
metadata:
  name: otel-sink
  namespace: envoy-gateway-system
spec:
  telemetry:
    metrics:
      sinks:
        - type: OpenTelemetry
          openTelemetry:
            host: otel-collector.monitoring.svc.cluster.local
            port: 4317
Temporarily enable the debug exporter in the OpenTelemetry Collector
to view metrics in the pod logs using the following command. Debug exporter is enabled for demonstration purposes and
should not be used in production.
helm upgrade eg-addons oci://docker.io/envoyproxy/gateway-addons-helm --version v1.4.2 -n monitoring --reuse-values --set opentelemetry-collector.config.service.pipelines.metrics.exporters='{debug,prometheus}'
To view the logs of the OpenTelemetry Collector, use the following command:
export OTEL_POD_NAME=$(kubectl get pod -n monitoring --selector=app.kubernetes.io/name=opentelemetry-collector -o jsonpath='{.items[0].metadata.name}')
kubectl logs -n monitoring -f $OTEL_POD_NAME --tail=100
Next Steps
Check out the Visualising metrics using Grafana section to learn more about how you can observe all the metrics in one place.
6 - Proxy Tracing
Envoy Gateway provides observability for the ControlPlane and the underlying EnvoyProxy instances. This task show you how to config proxy tracing.
Prerequisites
Install Envoy Gateway
Follow the steps below to install Envoy Gateway and the example manifest. Before proceeding, you should be able to query the example backend using HTTP.
Expand for instructions
Install the Gateway API CRDs and Envoy Gateway using Helm:
helm install eg oci://docker.io/envoyproxy/gateway-helm --version v1.4.2 -n envoy-gateway-system --create-namespaceInstall the GatewayClass, Gateway, HTTPRoute and example app:
kubectl apply -f https://github.com/envoyproxy/gateway/releases/download/v1.4.2/quickstart.yaml -n defaultVerify Connectivity:
Get the External IP of the Gateway:
export GATEWAY_HOST=$(kubectl get gateway/eg -o jsonpath='{.status.addresses[0].value}')Curl the example app through Envoy proxy:
curl --verbose --header "Host: www.example.com" http://$GATEWAY_HOST/getThe above command should succeed with status code 200.
Get the name of the Envoy service created the by the example Gateway:
export ENVOY_SERVICE=$(kubectl get svc -n envoy-gateway-system --selector=gateway.envoyproxy.io/owning-gateway-namespace=default,gateway.envoyproxy.io/owning-gateway-name=eg -o jsonpath='{.items[0].metadata.name}')Get the deployment of the Envoy service created the by the example Gateway:
export ENVOY_DEPLOYMENT=$(kubectl get deploy -n envoy-gateway-system --selector=gateway.envoyproxy.io/owning-gateway-namespace=default,gateway.envoyproxy.io/owning-gateway-name=eg -o jsonpath='{.items[0].metadata.name}')Port forward to the Envoy service:
kubectl -n envoy-gateway-system port-forward service/${ENVOY_SERVICE} 8888:80 &Curl the example app through Envoy proxy:
curl --verbose --header "Host: www.example.com" http://localhost:8888/getThe above command should succeed with status code 200.
Install Add-ons
Envoy Gateway provides an add-ons Helm chart to simplify the installation of observability components.
The documentation for the add-ons chart can be found
here.
Follow the instructions below to install the add-ons Helm chart.
helm install eg-addons oci://docker.io/envoyproxy/gateway-addons-helm --version v1.4.2 -n monitoring --create-namespace
By default, the OpenTelemetry Collector is disabled. To install add-ons with OpenTelemetry Collector enabled, use the following command.
helm install eg-addons oci://docker.io/envoyproxy/gateway-addons-helm --version v1.4.2 --set opentelemetry-collector.enabled=true -n monitoring --create-namespace
Expose Tempo endpoints:
TEMPO_IP=$(kubectl get svc tempo -n monitoring -o jsonpath='{.status.loadBalancer.ingress[0].ip}')
Traces
By default, Envoy Gateway doesn’t send traces to any sink.
You can enable traces by setting the telemetry.tracing in the EnvoyProxy CRD.
Currently, Envoy Gateway support OpenTelemetry, Zipkin and Datadog tracer.
Tracing Provider
The following configurations show how to apply proxy with different providers:
kubectl apply -f - <<EOF
apiVersion: gateway.networking.k8s.io/v1
kind: GatewayClass
metadata:
  name: eg
spec:
  controllerName: gateway.envoyproxy.io/gatewayclass-controller
  parametersRef:
    group: gateway.envoyproxy.io
    kind: EnvoyProxy
    name: otel
    namespace: envoy-gateway-system
---
apiVersion: gateway.envoyproxy.io/v1alpha1
kind: EnvoyProxy
metadata:
  name: otel
  namespace: envoy-gateway-system
spec:
  telemetry:
    tracing:
      # sample 100% of requests
      samplingRate: 100
      provider:
        backendRefs:
        - name: otel-collector
          namespace: monitoring
          port: 4317
        type: OpenTelemetry
      customTags:
        # This is an example of using a literal as a tag value
        provider:
          type: Literal
          literal:
            value: "otel"
        "k8s.pod.name":
          type: Environment
          environment:
            name: ENVOY_POD_NAME
            defaultValue: "-"
        "k8s.namespace.name":
          type: Environment
          environment:
            name: ENVOY_GATEWAY_NAMESPACE
            defaultValue: "envoy-gateway-system"
        # This is an example of using a header value as a tag value
        header1:
          type: RequestHeader
          requestHeader:
            name: X-Header-1
            defaultValue: "-"
EOF
Verify OpenTelemetry traces from tempo:
curl -s "http://$TEMPO_IP:3100/api/search?tags=component%3Dproxy+provider%3Dotel" | jq .traces
kubectl apply -f - <<EOF
apiVersion: gateway.networking.k8s.io/v1
kind: GatewayClass
metadata:
  name: eg
spec:
  controllerName: gateway.envoyproxy.io/gatewayclass-controller
  parametersRef:
    group: gateway.envoyproxy.io
    kind: EnvoyProxy
    name: zipkin
    namespace: envoy-gateway-system
---
apiVersion: gateway.envoyproxy.io/v1alpha1
kind: EnvoyProxy
metadata:
  name: zipkin
  namespace: envoy-gateway-system
spec:
  telemetry:
    tracing:
      # sample 100% of requests
      samplingRate: 100
      provider:
        backendRefs:
        - name: otel-collector
          namespace: monitoring
          port: 9411
        type: Zipkin
        zipkin:
          enable128BitTraceId: true
      customTags:
        # This is an example of using a literal as a tag value
        provider:
          type: Literal
          literal:
            value: "zipkin"
        "k8s.pod.name":
          type: Environment
          environment:
            name: ENVOY_POD_NAME
            defaultValue: "-"
        "k8s.namespace.name":
          type: Environment
          environment:
            name: ENVOY_GATEWAY_NAMESPACE
            defaultValue: "envoy-gateway-system"
        # This is an example of using a header value as a tag value
        header1:
          type: RequestHeader
          requestHeader:
            name: X-Header-1
            defaultValue: "-"
EOF
Verify zipkin traces from tempo:
curl -s "http://$TEMPO_IP:3100/api/search?tags=component%3Dproxy+provider%3Dzipkin" | jq .traces
kubectl apply -f - <<EOF
apiVersion: gateway.networking.k8s.io/v1
kind: GatewayClass
metadata:
  name: eg
spec:
  controllerName: gateway.envoyproxy.io/gatewayclass-controller
  parametersRef:
    group: gateway.envoyproxy.io
    kind: EnvoyProxy
    name: datadog
    namespace: envoy-gateway-system
---
apiVersion: gateway.envoyproxy.io/v1alpha1
kind: EnvoyProxy
metadata:
  name: datadog
  namespace: envoy-gateway-system
spec:
  telemetry:
    tracing:
      # sample 100% of requests
      samplingRate: 100
      provider:
        backendRefs:
        - name: datadog-agent
          namespace: monitoring
          port: 8126
        type: Datadog
      customTags:
        # This is an example of using a literal as a tag value
        provider:
          type: Literal
          literal:
            value: "datadog"
        "k8s.pod.name":
          type: Environment
          environment:
            name: ENVOY_POD_NAME
            defaultValue: "-"
        "k8s.namespace.name":
          type: Environment
          environment:
            name: ENVOY_GATEWAY_NAMESPACE
            defaultValue: "envoy-gateway-system"
        # This is an example of using a header value as a tag value
        header1:
          type: RequestHeader
          requestHeader:
            name: X-Header-1
            defaultValue: "-"
EOF
Verify Datadog traces in Datadog APM
Query trace by trace id:
curl -s "http://$TEMPO_IP:3100/api/traces/<trace_id>" | jq
Sampling Rate
Envoy Gateway use 100% sample rate, which means all requests will be traced.
This may cause performance issues when traffic is very high, you can adjust
the sample rate by setting the telemetry.tracing.samplingRate in the EnvoyProxy CRD.
The following configurations show how to apply proxy with 1% sample rates:
kubectl apply -f - <<EOF
apiVersion: gateway.networking.k8s.io/v1
kind: GatewayClass
metadata:
  name: eg
spec:
  controllerName: gateway.envoyproxy.io/gatewayclass-controller
  parametersRef:
    group: gateway.envoyproxy.io
    kind: EnvoyProxy
    name: otel
    namespace: envoy-gateway-system
---
apiVersion: gateway.envoyproxy.io/v1alpha1
kind: EnvoyProxy
metadata:
  name: otel
  namespace: envoy-gateway-system
spec:
  telemetry:
    tracing:
      # sample 1% of requests
      samplingRate: 1
      provider:
        backendRefs:
        - name: otel-collector
          namespace: monitoring
          port: 4317
        type: OpenTelemetry
      customTags:
        # This is an example of using a literal as a tag value
        provider:
          type: Literal
          literal:
            value: "otel"
        "k8s.pod.name":
          type: Environment
          environment:
            name: ENVOY_POD_NAME
            defaultValue: "-"
        "k8s.namespace.name":
          type: Environment
          environment:
            name: ENVOY_GATEWAY_NAMESPACE
            defaultValue: "envoy-gateway-system"
        # This is an example of using a header value as a tag value
        header1:
          type: RequestHeader
          requestHeader:
            name: X-Header-1
            defaultValue: "-"
EOF
If you want the sample rate to less than 1%, you can use the telemetry.tracing.samplingFraction field in the EnvoyProxy CRD.
kubectl apply -f - <<EOF
apiVersion: gateway.networking.k8s.io/v1
kind: GatewayClass
metadata:
  name: eg
spec:
  controllerName: gateway.envoyproxy.io/gatewayclass-controller
  parametersRef:
    group: gateway.envoyproxy.io
    kind: EnvoyProxy
    name: otel
    namespace: envoy-gateway-system
---
apiVersion: gateway.envoyproxy.io/v1alpha1
kind: EnvoyProxy
metadata:
  name: otel
  namespace: envoy-gateway-system
spec:
  telemetry:
    tracing:
      # sample 0.1% of requests
      samplingFraction:
        numerator: 1
        denominator: 1000
      provider:
        backendRefs:
        - name: otel-collector
          namespace: monitoring
          port: 4317
        type: OpenTelemetry
      customTags:
        # This is an example of using a literal as a tag value
        provider:
          type: Literal
          literal:
            value: "otel"
        "k8s.pod.name":
          type: Environment
          environment:
            name: ENVOY_POD_NAME
            defaultValue: "-"
        "k8s.namespace.name":
          type: Environment
          environment:
            name: ENVOY_GATEWAY_NAMESPACE
            defaultValue: "envoy-gateway-system"
        # This is an example of using a header value as a tag value
        header1:
          type: RequestHeader
          requestHeader:
            name: X-Header-1
            defaultValue: "-"
EOF
7 - RateLimit Observability
Envoy Gateway provides observability for the RateLimit instances. This guide show you how to config RateLimit observability, includes traces.
Prerequisites
Install Envoy Gateway
Follow the steps below to install Envoy Gateway and the example manifest. Before proceeding, you should be able to query the example backend using HTTP.
Expand for instructions
Install the Gateway API CRDs and Envoy Gateway using Helm:
helm install eg oci://docker.io/envoyproxy/gateway-helm --version v1.4.2 -n envoy-gateway-system --create-namespaceInstall the GatewayClass, Gateway, HTTPRoute and example app:
kubectl apply -f https://github.com/envoyproxy/gateway/releases/download/v1.4.2/quickstart.yaml -n defaultVerify Connectivity:
Get the External IP of the Gateway:
export GATEWAY_HOST=$(kubectl get gateway/eg -o jsonpath='{.status.addresses[0].value}')Curl the example app through Envoy proxy:
curl --verbose --header "Host: www.example.com" http://$GATEWAY_HOST/getThe above command should succeed with status code 200.
Get the name of the Envoy service created the by the example Gateway:
export ENVOY_SERVICE=$(kubectl get svc -n envoy-gateway-system --selector=gateway.envoyproxy.io/owning-gateway-namespace=default,gateway.envoyproxy.io/owning-gateway-name=eg -o jsonpath='{.items[0].metadata.name}')Get the deployment of the Envoy service created the by the example Gateway:
export ENVOY_DEPLOYMENT=$(kubectl get deploy -n envoy-gateway-system --selector=gateway.envoyproxy.io/owning-gateway-namespace=default,gateway.envoyproxy.io/owning-gateway-name=eg -o jsonpath='{.items[0].metadata.name}')Port forward to the Envoy service:
kubectl -n envoy-gateway-system port-forward service/${ENVOY_SERVICE} 8888:80 &Curl the example app through Envoy proxy:
curl --verbose --header "Host: www.example.com" http://localhost:8888/getThe above command should succeed with status code 200.
Install Add-ons
Envoy Gateway provides an add-ons Helm chart to simplify the installation of observability components.
The documentation for the add-ons chart can be found
here.
Follow the instructions below to install the add-ons Helm chart.
helm install eg-addons oci://docker.io/envoyproxy/gateway-addons-helm --version v1.4.2 -n monitoring --create-namespace
By default, the OpenTelemetry Collector is disabled. To install add-ons with OpenTelemetry Collector enabled, use the following command.
helm install eg-addons oci://docker.io/envoyproxy/gateway-addons-helm --version v1.4.2 --set opentelemetry-collector.enabled=true -n monitoring --create-namespace
Follow the steps from the Global Rate Limit to install RateLimit.
Traces
By default, the Envoy Gateway does not configure RateLimit to send traces to the OpenTelemetry Sink.
You can configure the collector in the rateLimit.telemetry.tracing of the EnvoyGatewayCRD.
RateLimit uses the OpenTelemetry Exporter to export traces to the collector. You can configure a collector that supports the OTLP protocol, which includes but is not limited to: OpenTelemetry Collector, Jaeger, Zipkin, and so on.
Note:
- By default, the Envoy Gateway configures a
100%sampling rate for RateLimit, which may lead to performance issues.
Assuming the OpenTelemetry Collector is running in the observability namespace, and it has a service named otel-svc,
we only want to sample 50% of the trace data. We would configure it as follows:
cat <<EOF | kubectl apply -f -
apiVersion: v1
kind: ConfigMap
metadata:
  name: envoy-gateway-config
  namespace: envoy-gateway-system
data:
  envoy-gateway.yaml: |
    apiVersion: gateway.envoyproxy.io/v1alpha1
    kind: EnvoyGateway
    provider:
      type: Kubernetes
    gateway:
      controllerName: gateway.envoyproxy.io/gatewayclass-controller
    rateLimit:
      backend:
        type: Redis
        redis:
          url: redis-service.default.svc.cluster.local:6379
      telemetry:
        tracing:
          sampleRate: 50
          provider:
            url: otel-svc.observability.svc.cluster.local:4318
EOF
Save and apply the following resource to your cluster:
---
apiVersion: v1
kind: ConfigMap
metadata:
  name: envoy-gateway-config
  namespace: envoy-gateway-system
data:
  envoy-gateway.yaml: |
    apiVersion: gateway.envoyproxy.io/v1alpha1
    kind: EnvoyGateway
    provider:
      type: Kubernetes
    gateway:
      controllerName: gateway.envoyproxy.io/gatewayclass-controller
    rateLimit:
      backend:
        type: Redis
        redis:
          url: redis-service.default.svc.cluster.local:6379
      telemetry:
        tracing:
          sampleRate: 50
          provider:
            url: otel-svc.observability.svc.cluster.local:4318
After updating the
ConfigMap, you will need to wait the configuration kicks in.
You can force the configuration to be reloaded by restarting theenvoy-gatewaydeployment.kubectl rollout restart deployment envoy-gateway -n envoy-gateway-system
8 - Visualising metrics using Grafana
Envoy Gateway provides support for exposing Envoy Gateway and Envoy Proxy metrics to a Prometheus instance. This task shows you how to visualise the metrics exposed to Prometheus using Grafana.
Prerequisites
Install Envoy Gateway
Follow the steps below to install Envoy Gateway and the example manifest. Before proceeding, you should be able to query the example backend using HTTP.
Expand for instructions
Install the Gateway API CRDs and Envoy Gateway using Helm:
helm install eg oci://docker.io/envoyproxy/gateway-helm --version v1.4.2 -n envoy-gateway-system --create-namespaceInstall the GatewayClass, Gateway, HTTPRoute and example app:
kubectl apply -f https://github.com/envoyproxy/gateway/releases/download/v1.4.2/quickstart.yaml -n defaultVerify Connectivity:
Get the External IP of the Gateway:
export GATEWAY_HOST=$(kubectl get gateway/eg -o jsonpath='{.status.addresses[0].value}')Curl the example app through Envoy proxy:
curl --verbose --header "Host: www.example.com" http://$GATEWAY_HOST/getThe above command should succeed with status code 200.
Get the name of the Envoy service created the by the example Gateway:
export ENVOY_SERVICE=$(kubectl get svc -n envoy-gateway-system --selector=gateway.envoyproxy.io/owning-gateway-namespace=default,gateway.envoyproxy.io/owning-gateway-name=eg -o jsonpath='{.items[0].metadata.name}')Get the deployment of the Envoy service created the by the example Gateway:
export ENVOY_DEPLOYMENT=$(kubectl get deploy -n envoy-gateway-system --selector=gateway.envoyproxy.io/owning-gateway-namespace=default,gateway.envoyproxy.io/owning-gateway-name=eg -o jsonpath='{.items[0].metadata.name}')Port forward to the Envoy service:
kubectl -n envoy-gateway-system port-forward service/${ENVOY_SERVICE} 8888:80 &Curl the example app through Envoy proxy:
curl --verbose --header "Host: www.example.com" http://localhost:8888/getThe above command should succeed with status code 200.
Install Add-ons
Envoy Gateway provides an add-ons Helm chart to simplify the installation of observability components.
The documentation for the add-ons chart can be found
here.
Follow the instructions below to install the add-ons Helm chart.
helm install eg-addons oci://docker.io/envoyproxy/gateway-addons-helm --version v1.4.2 -n monitoring --create-namespace
By default, the OpenTelemetry Collector is disabled. To install add-ons with OpenTelemetry Collector enabled, use the following command.
helm install eg-addons oci://docker.io/envoyproxy/gateway-addons-helm --version v1.4.2 --set opentelemetry-collector.enabled=true -n monitoring --create-namespace
Follow the steps from the Gateway Observability and Proxy Metrics to enable Prometheus metrics for both Envoy Gateway (Control Plane) and Envoy Proxy (Data Plane).
Expose endpoints:
GRAFANA_IP=$(kubectl get svc grafana -n monitoring -o jsonpath='{.status.loadBalancer.ingress[0].ip}')
Connecting Grafana with Prometheus datasource
To visualise metrics from Prometheus, we have to connect Grafana with Prometheus. If you installed Grafana follow the command from prerequisites sections, the Prometheus datasource should be already configured.
You can also add the datasource manually by following the instructions from Grafana Docs.
Accessing Grafana
You can access the Grafana instance by visiting http://{GRAFANA_IP}, derived in prerequisites.
To log in to Grafana, use the credentials admin:admin.
Envoy Gateway has examples of dashboard for you to get started, you can check them out under Dashboards/envoy-gateway.
If you’d like import Grafana dashboards on your own, please refer to Grafana docs for importing dashboards.
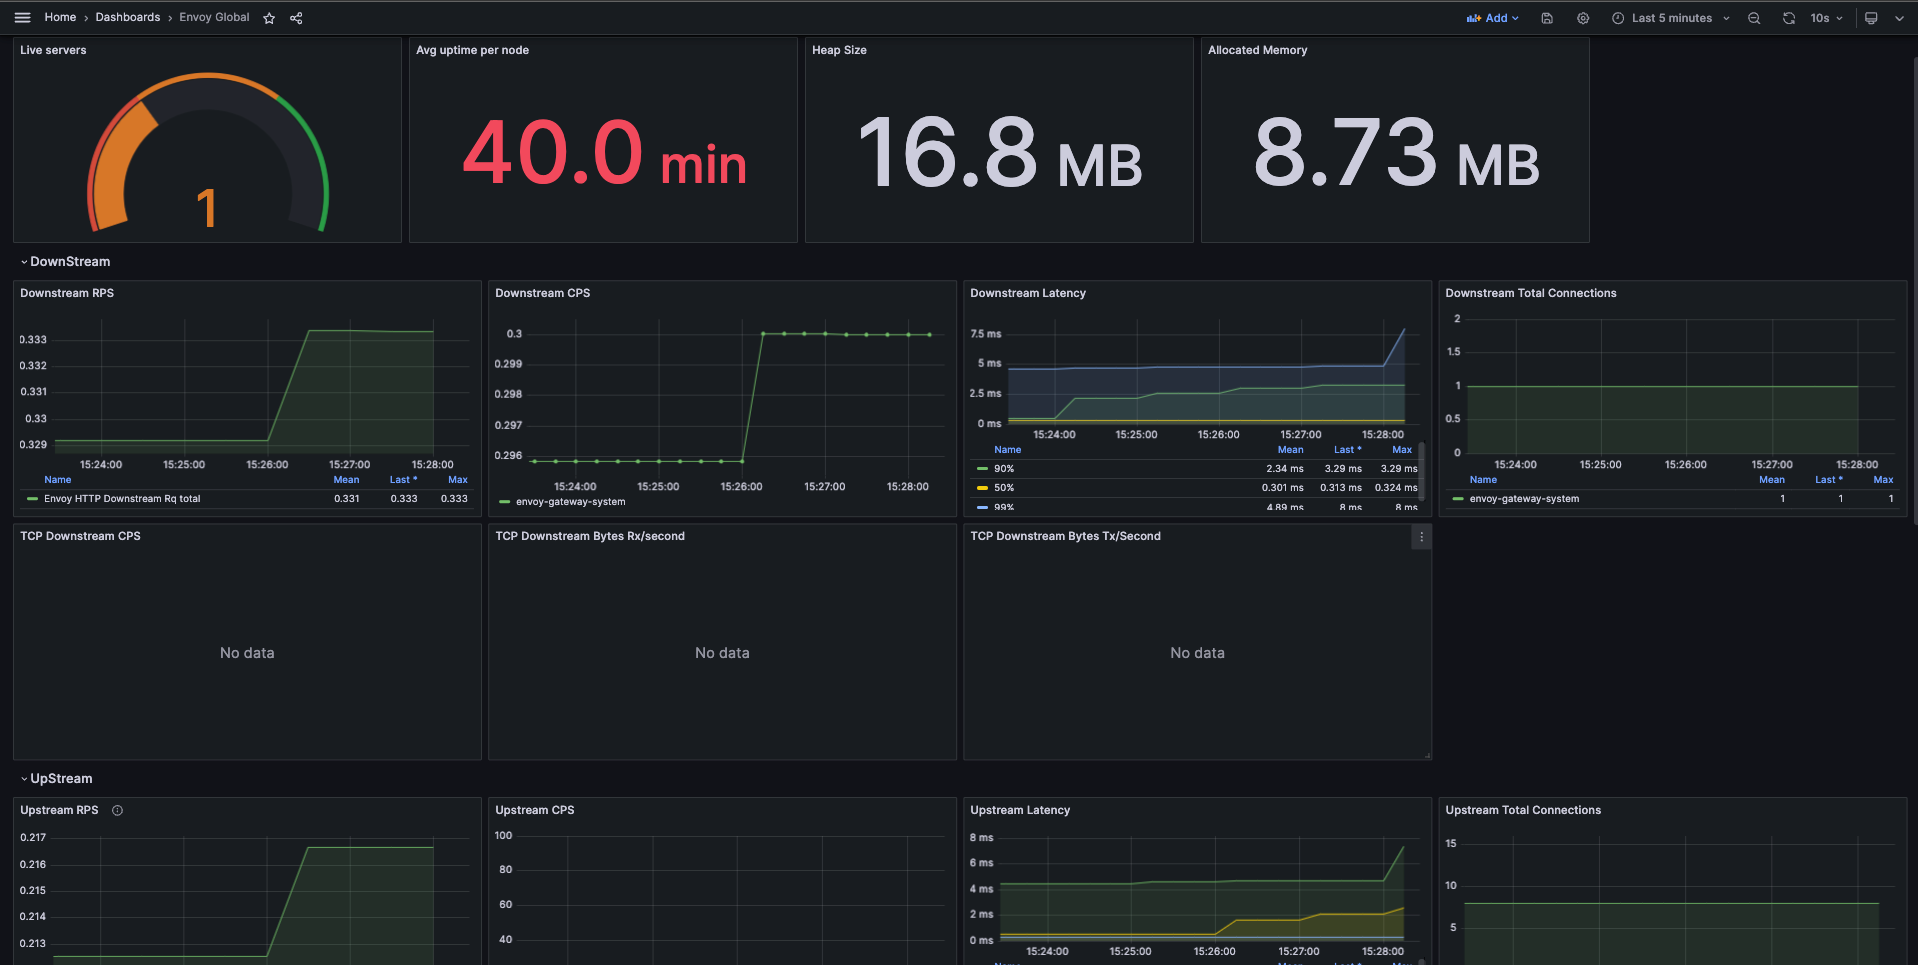
Envoy Proxy Global
This dashboard example shows the overall downstream and upstream stats for each Envoy Proxy instance.
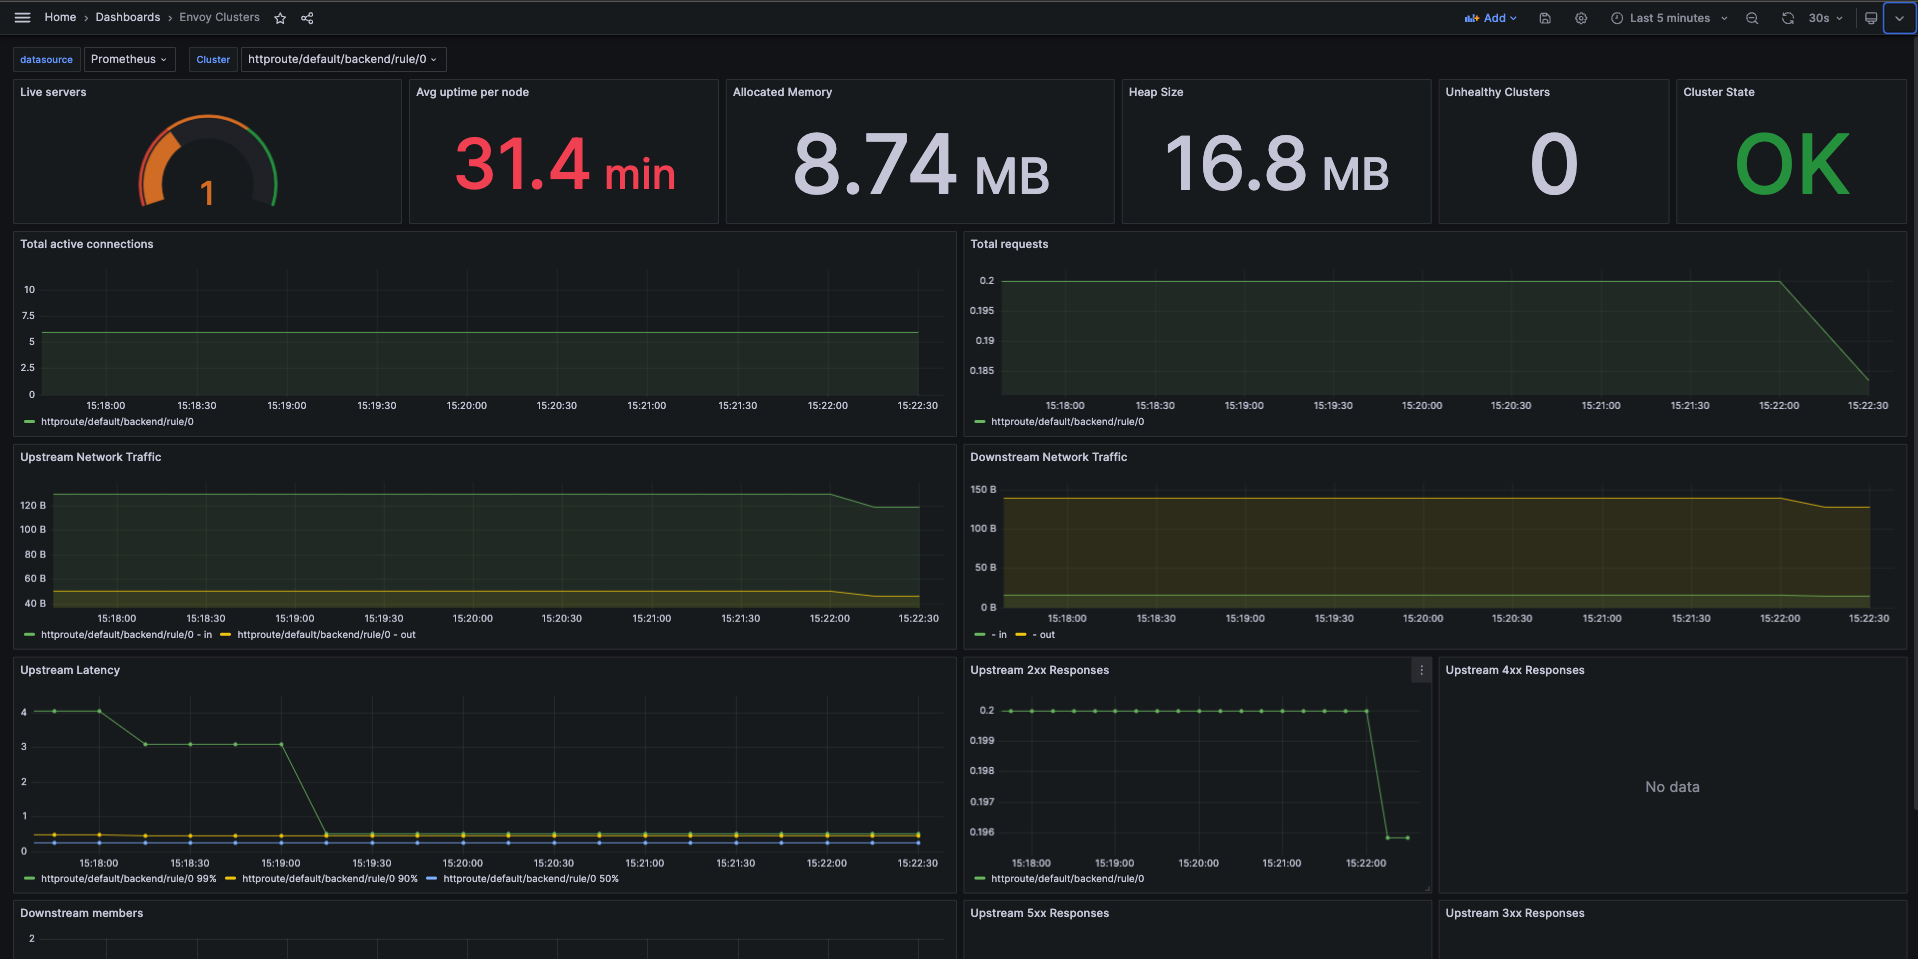
Envoy Clusters
This dashboard example shows the overall stats for each cluster from Envoy Proxy fleet.
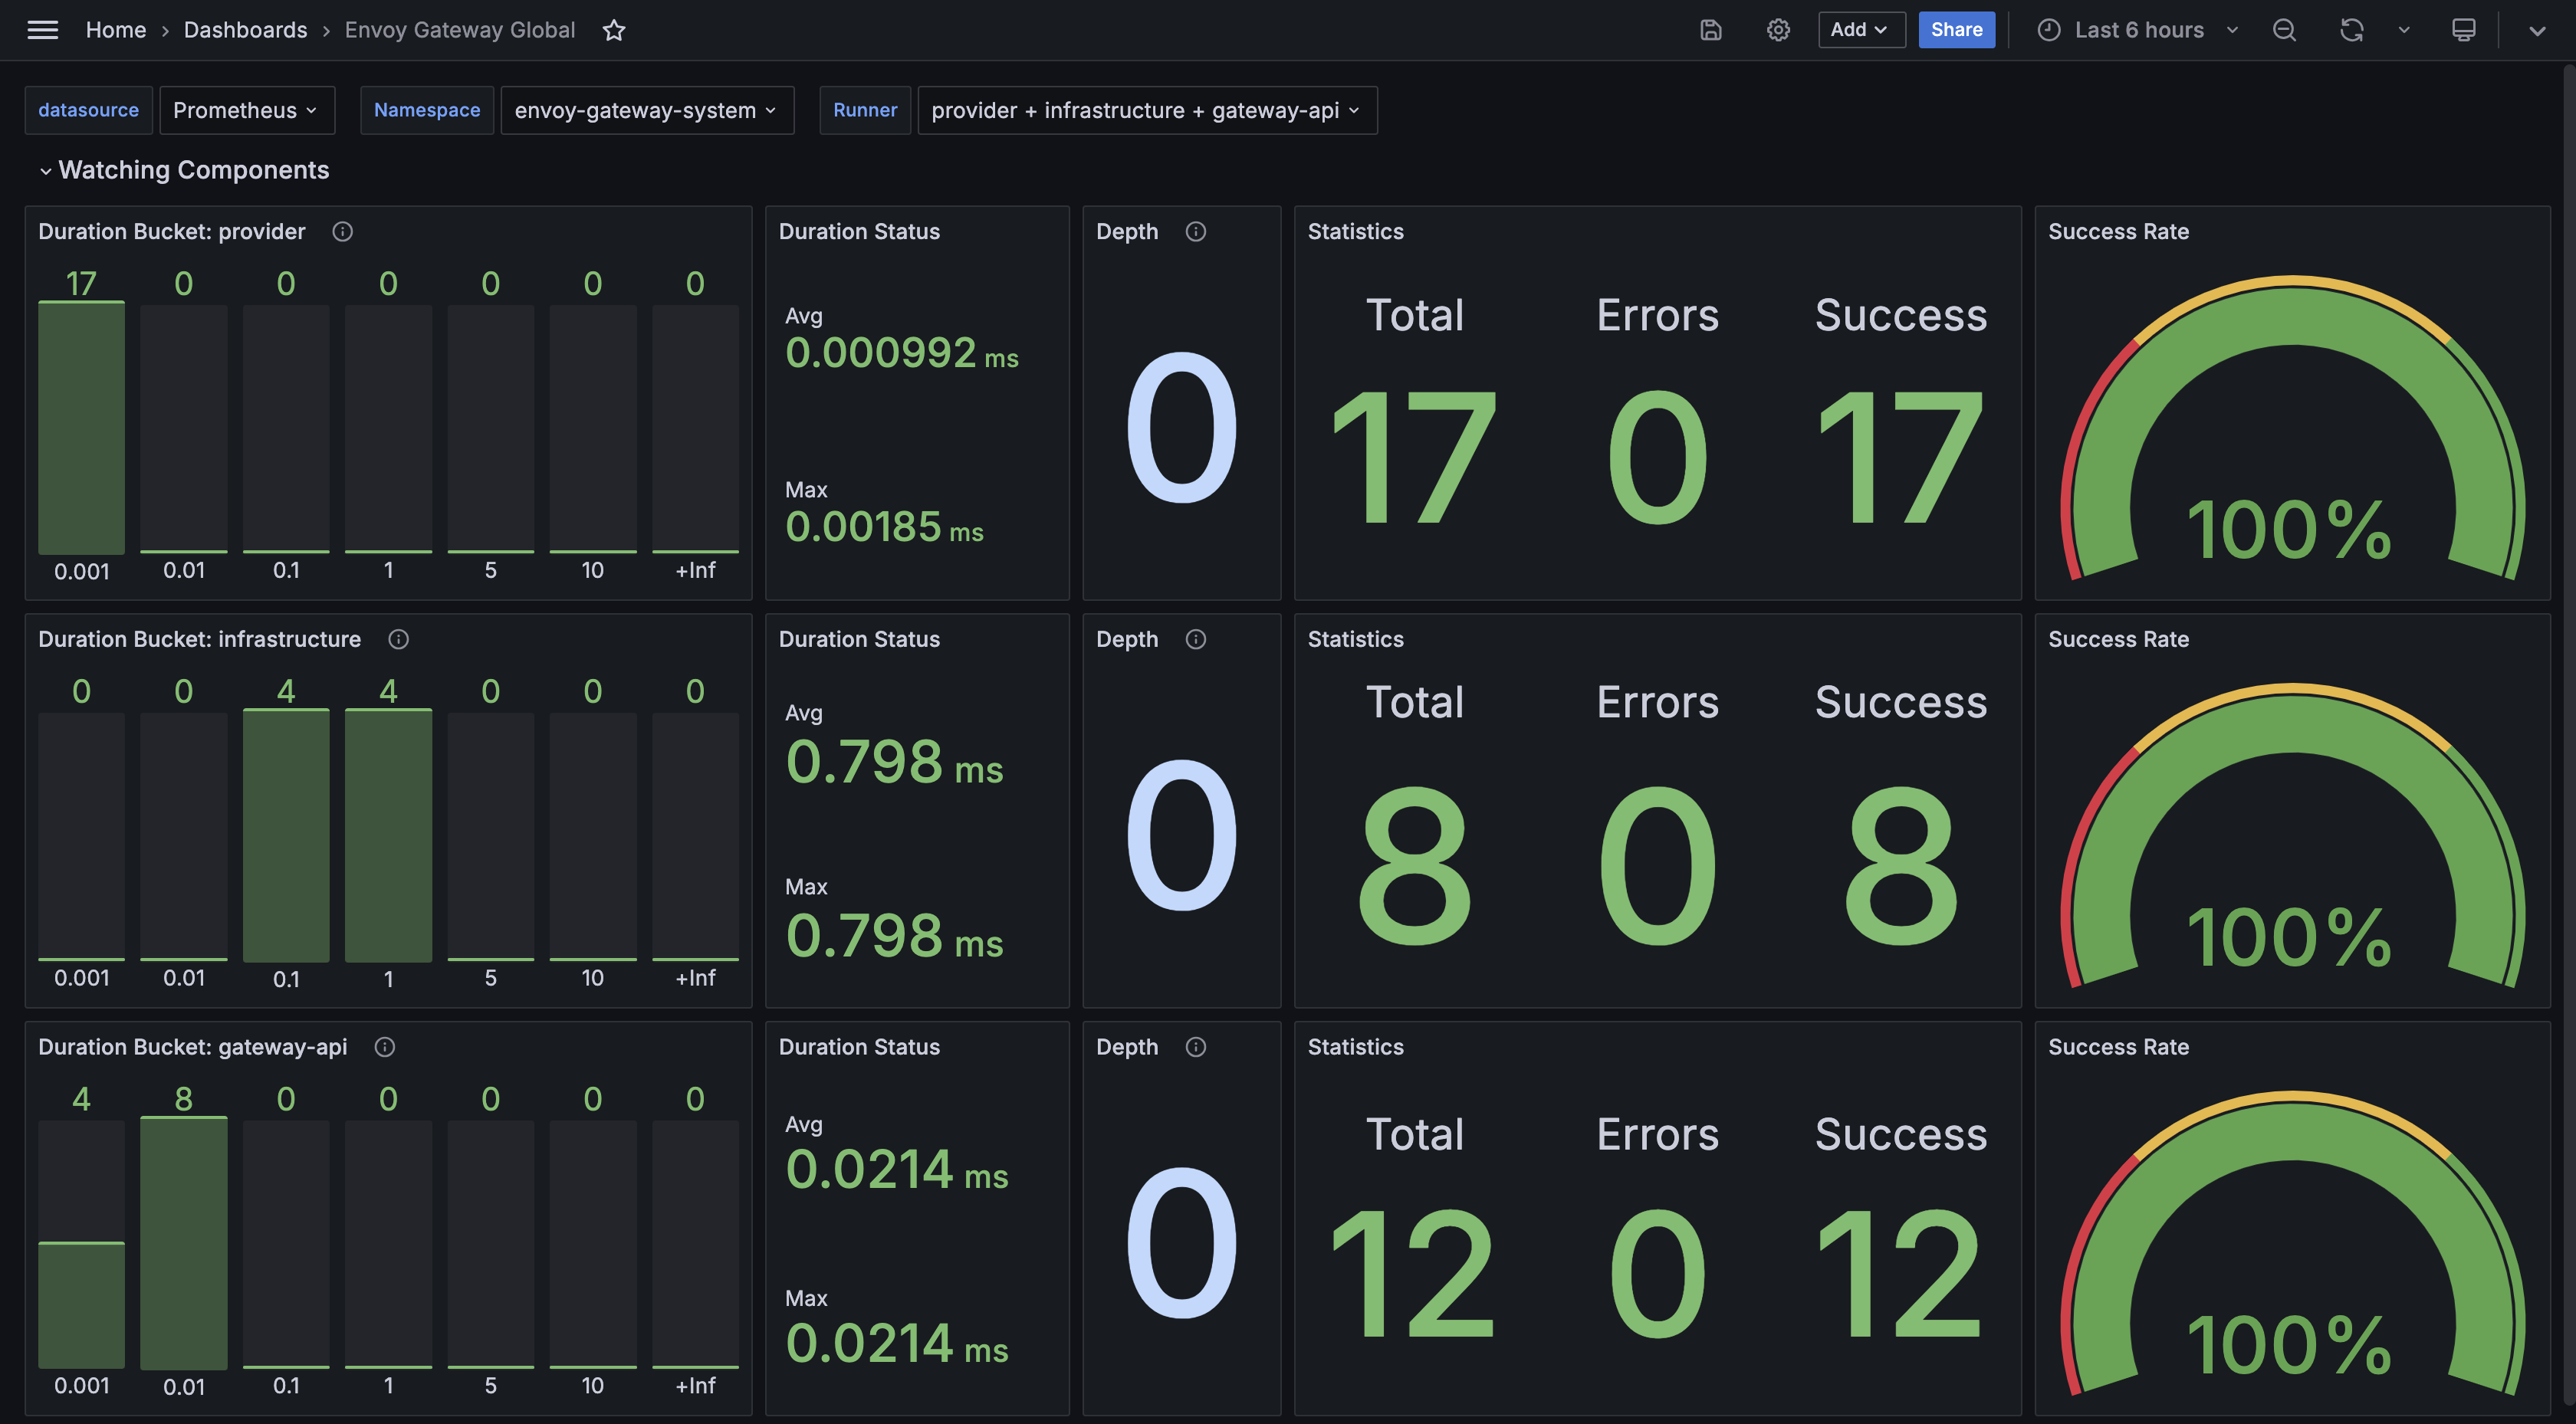
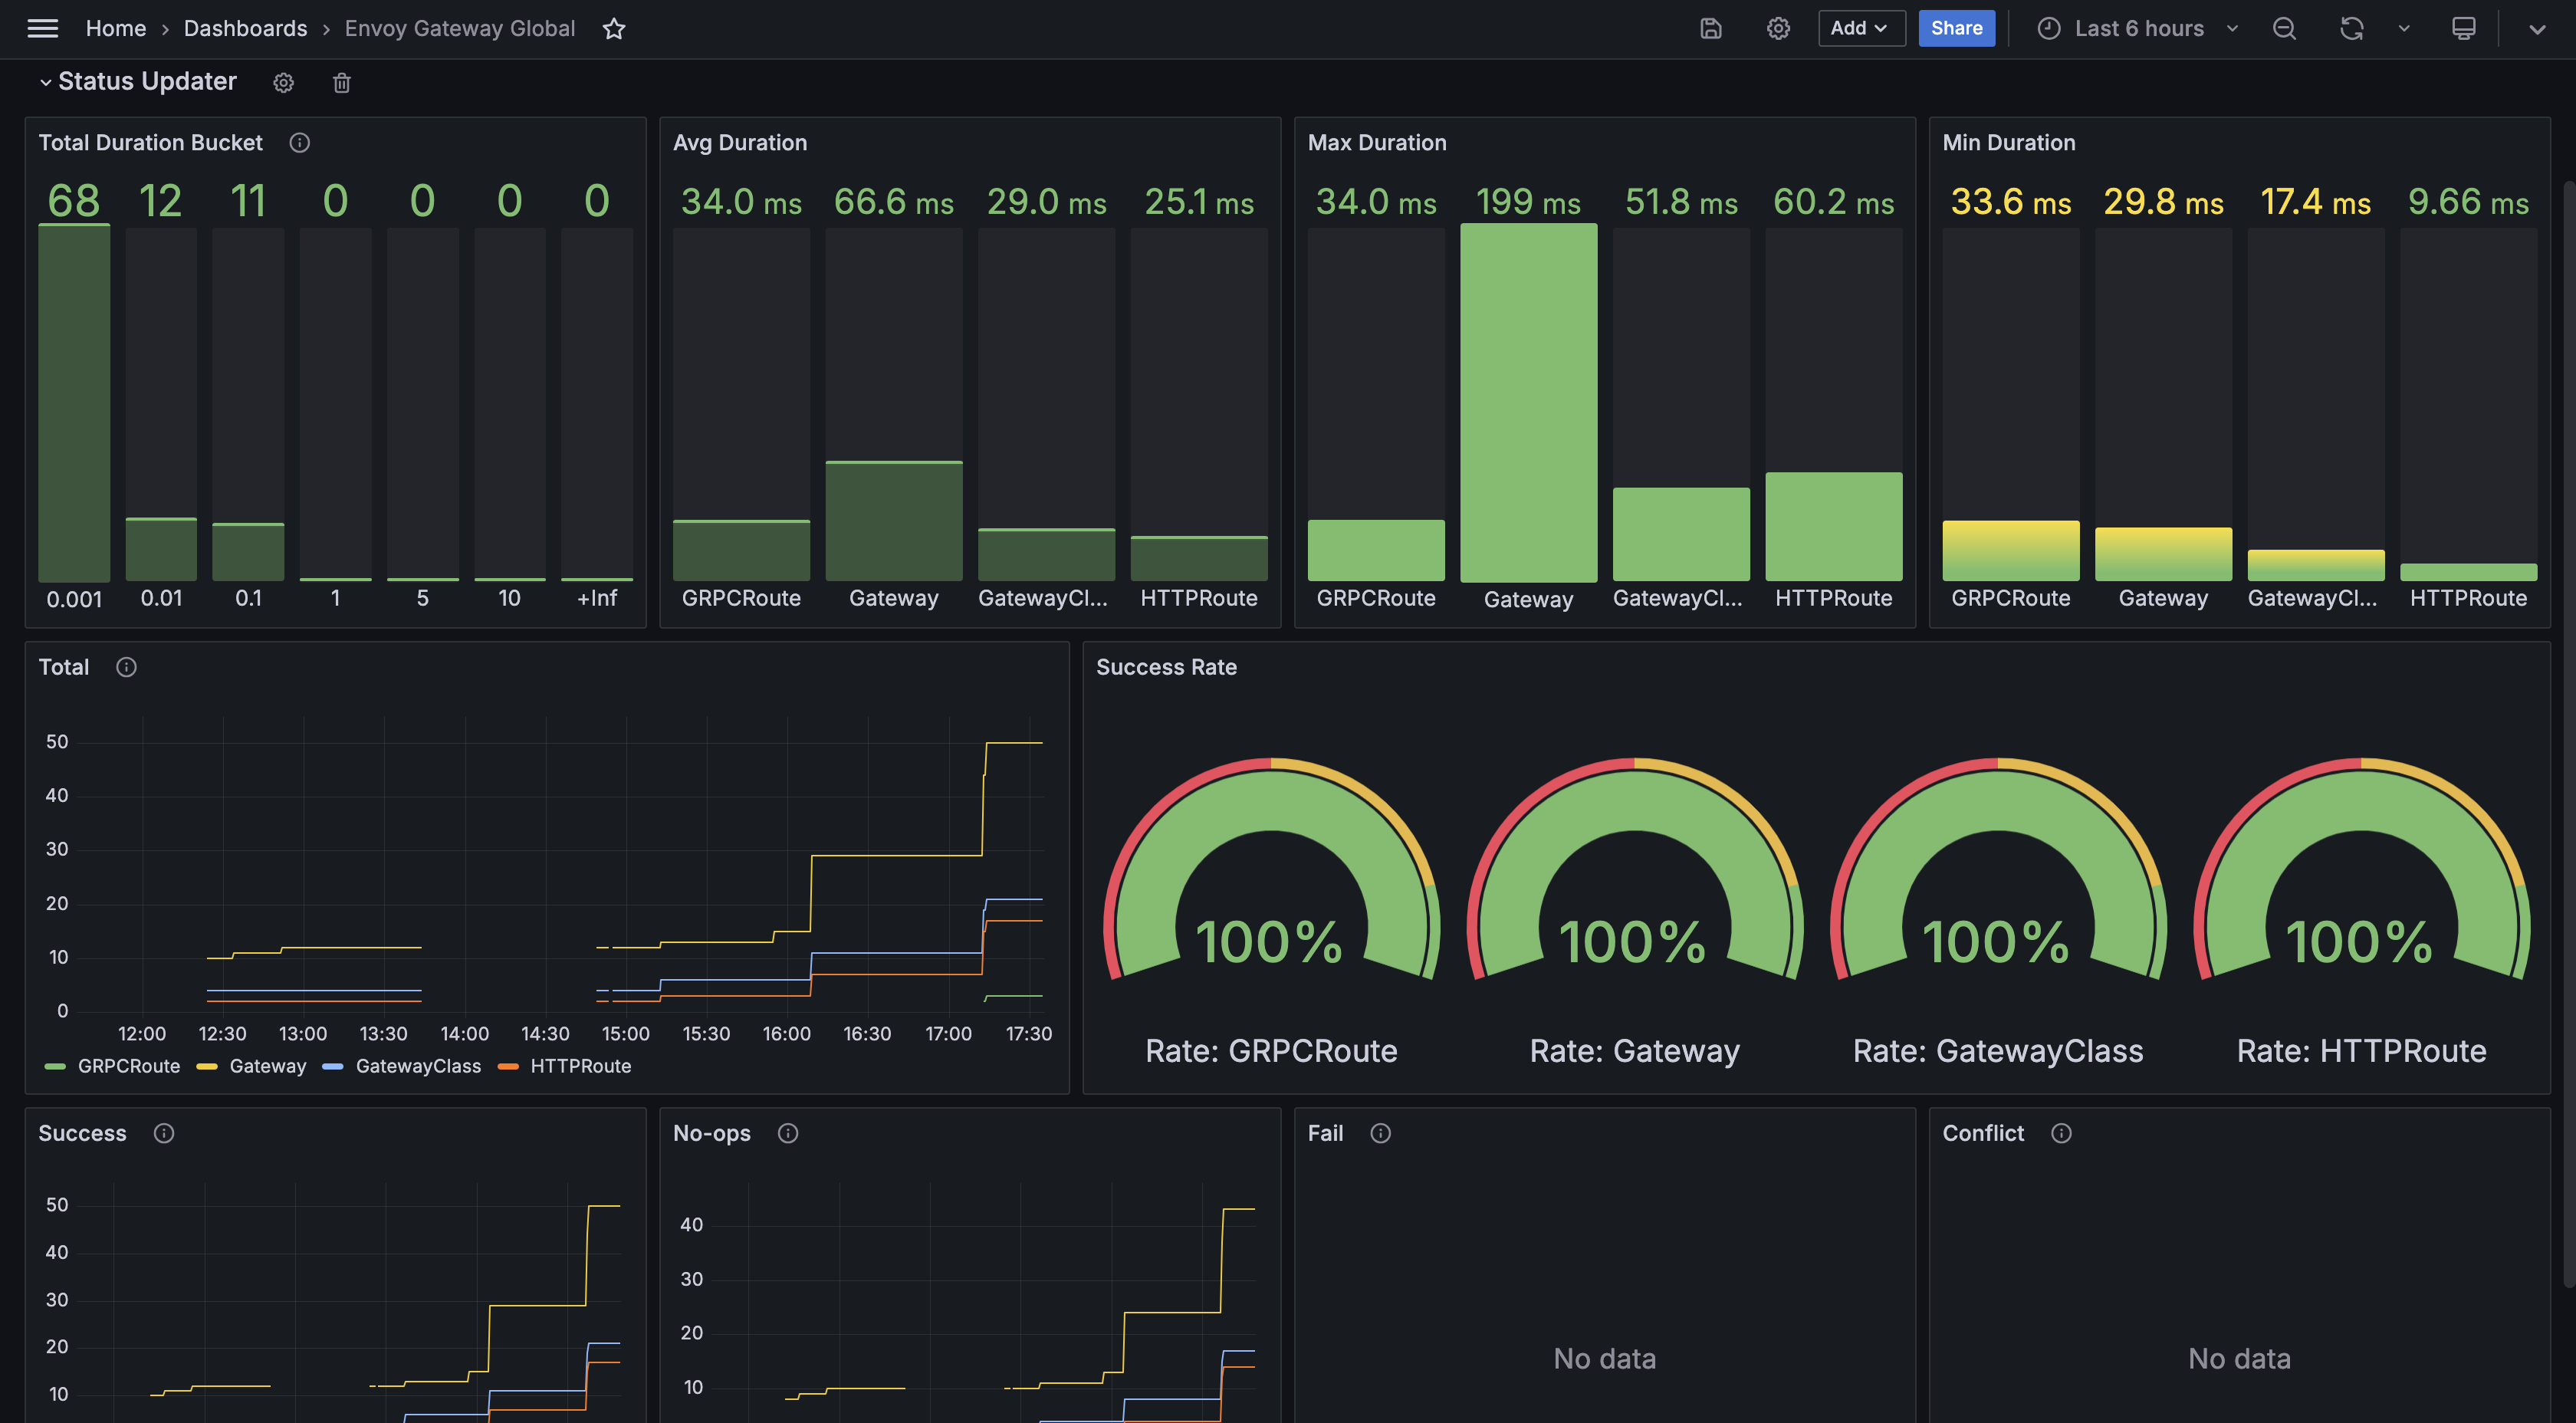
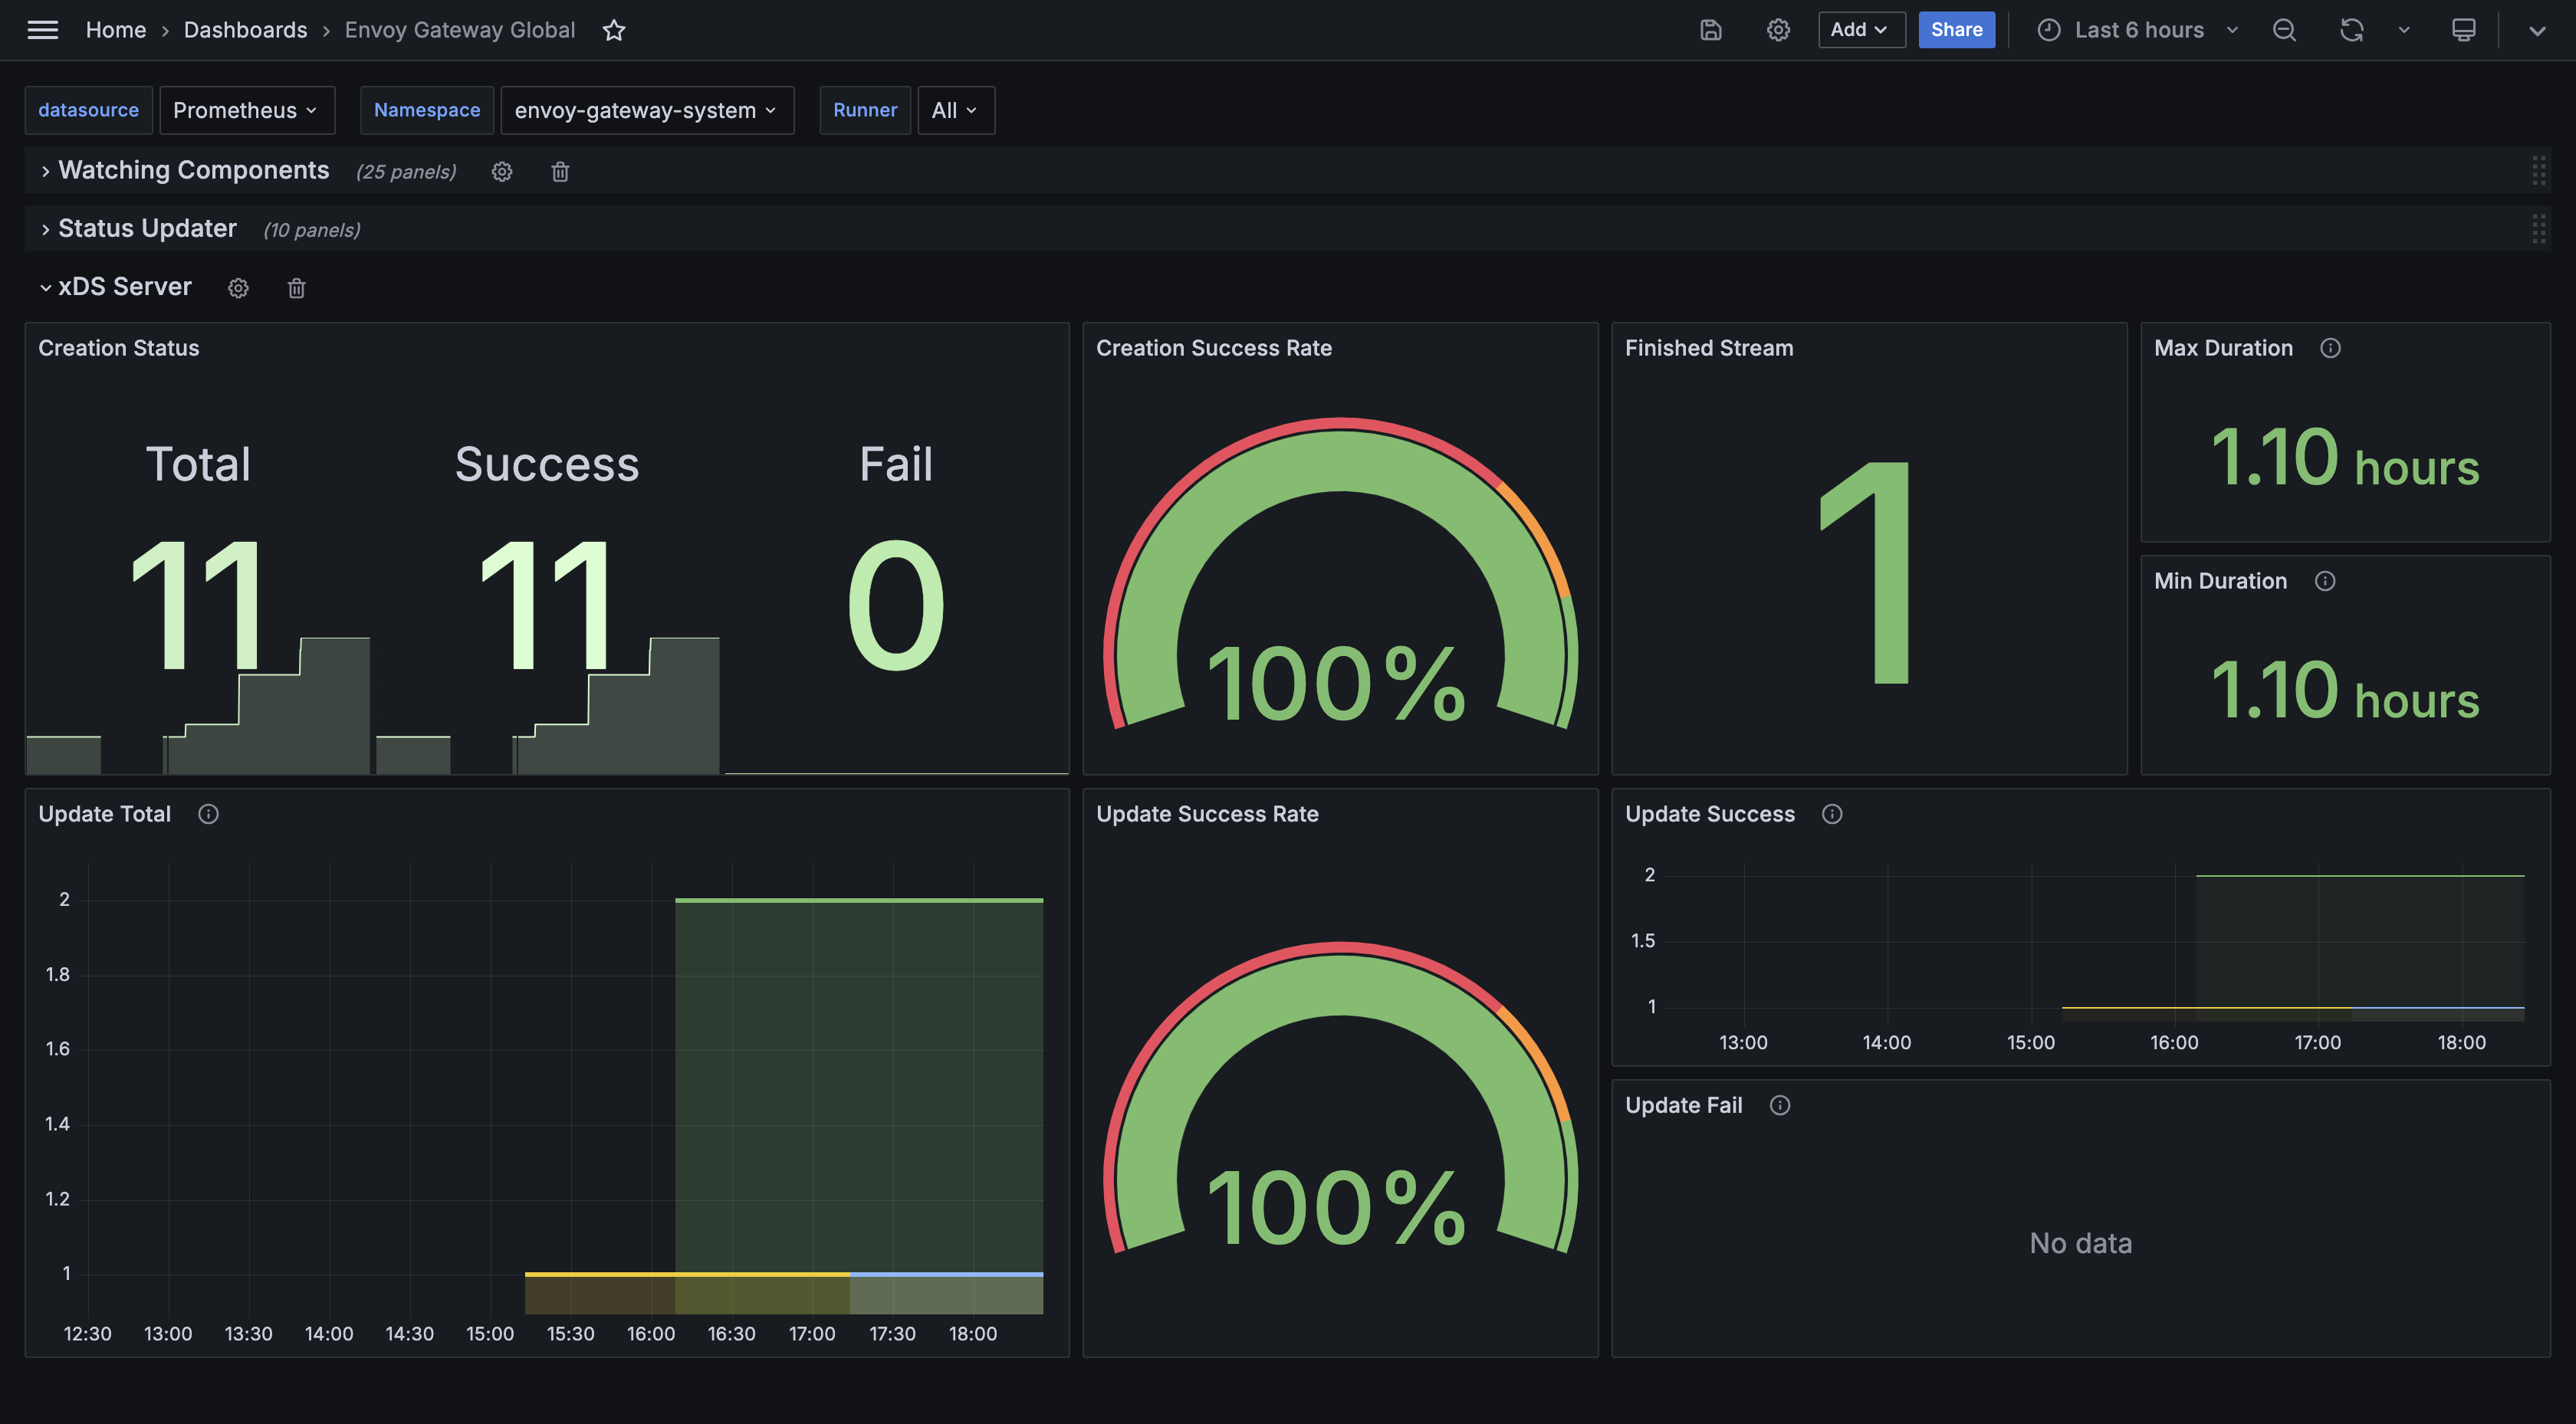
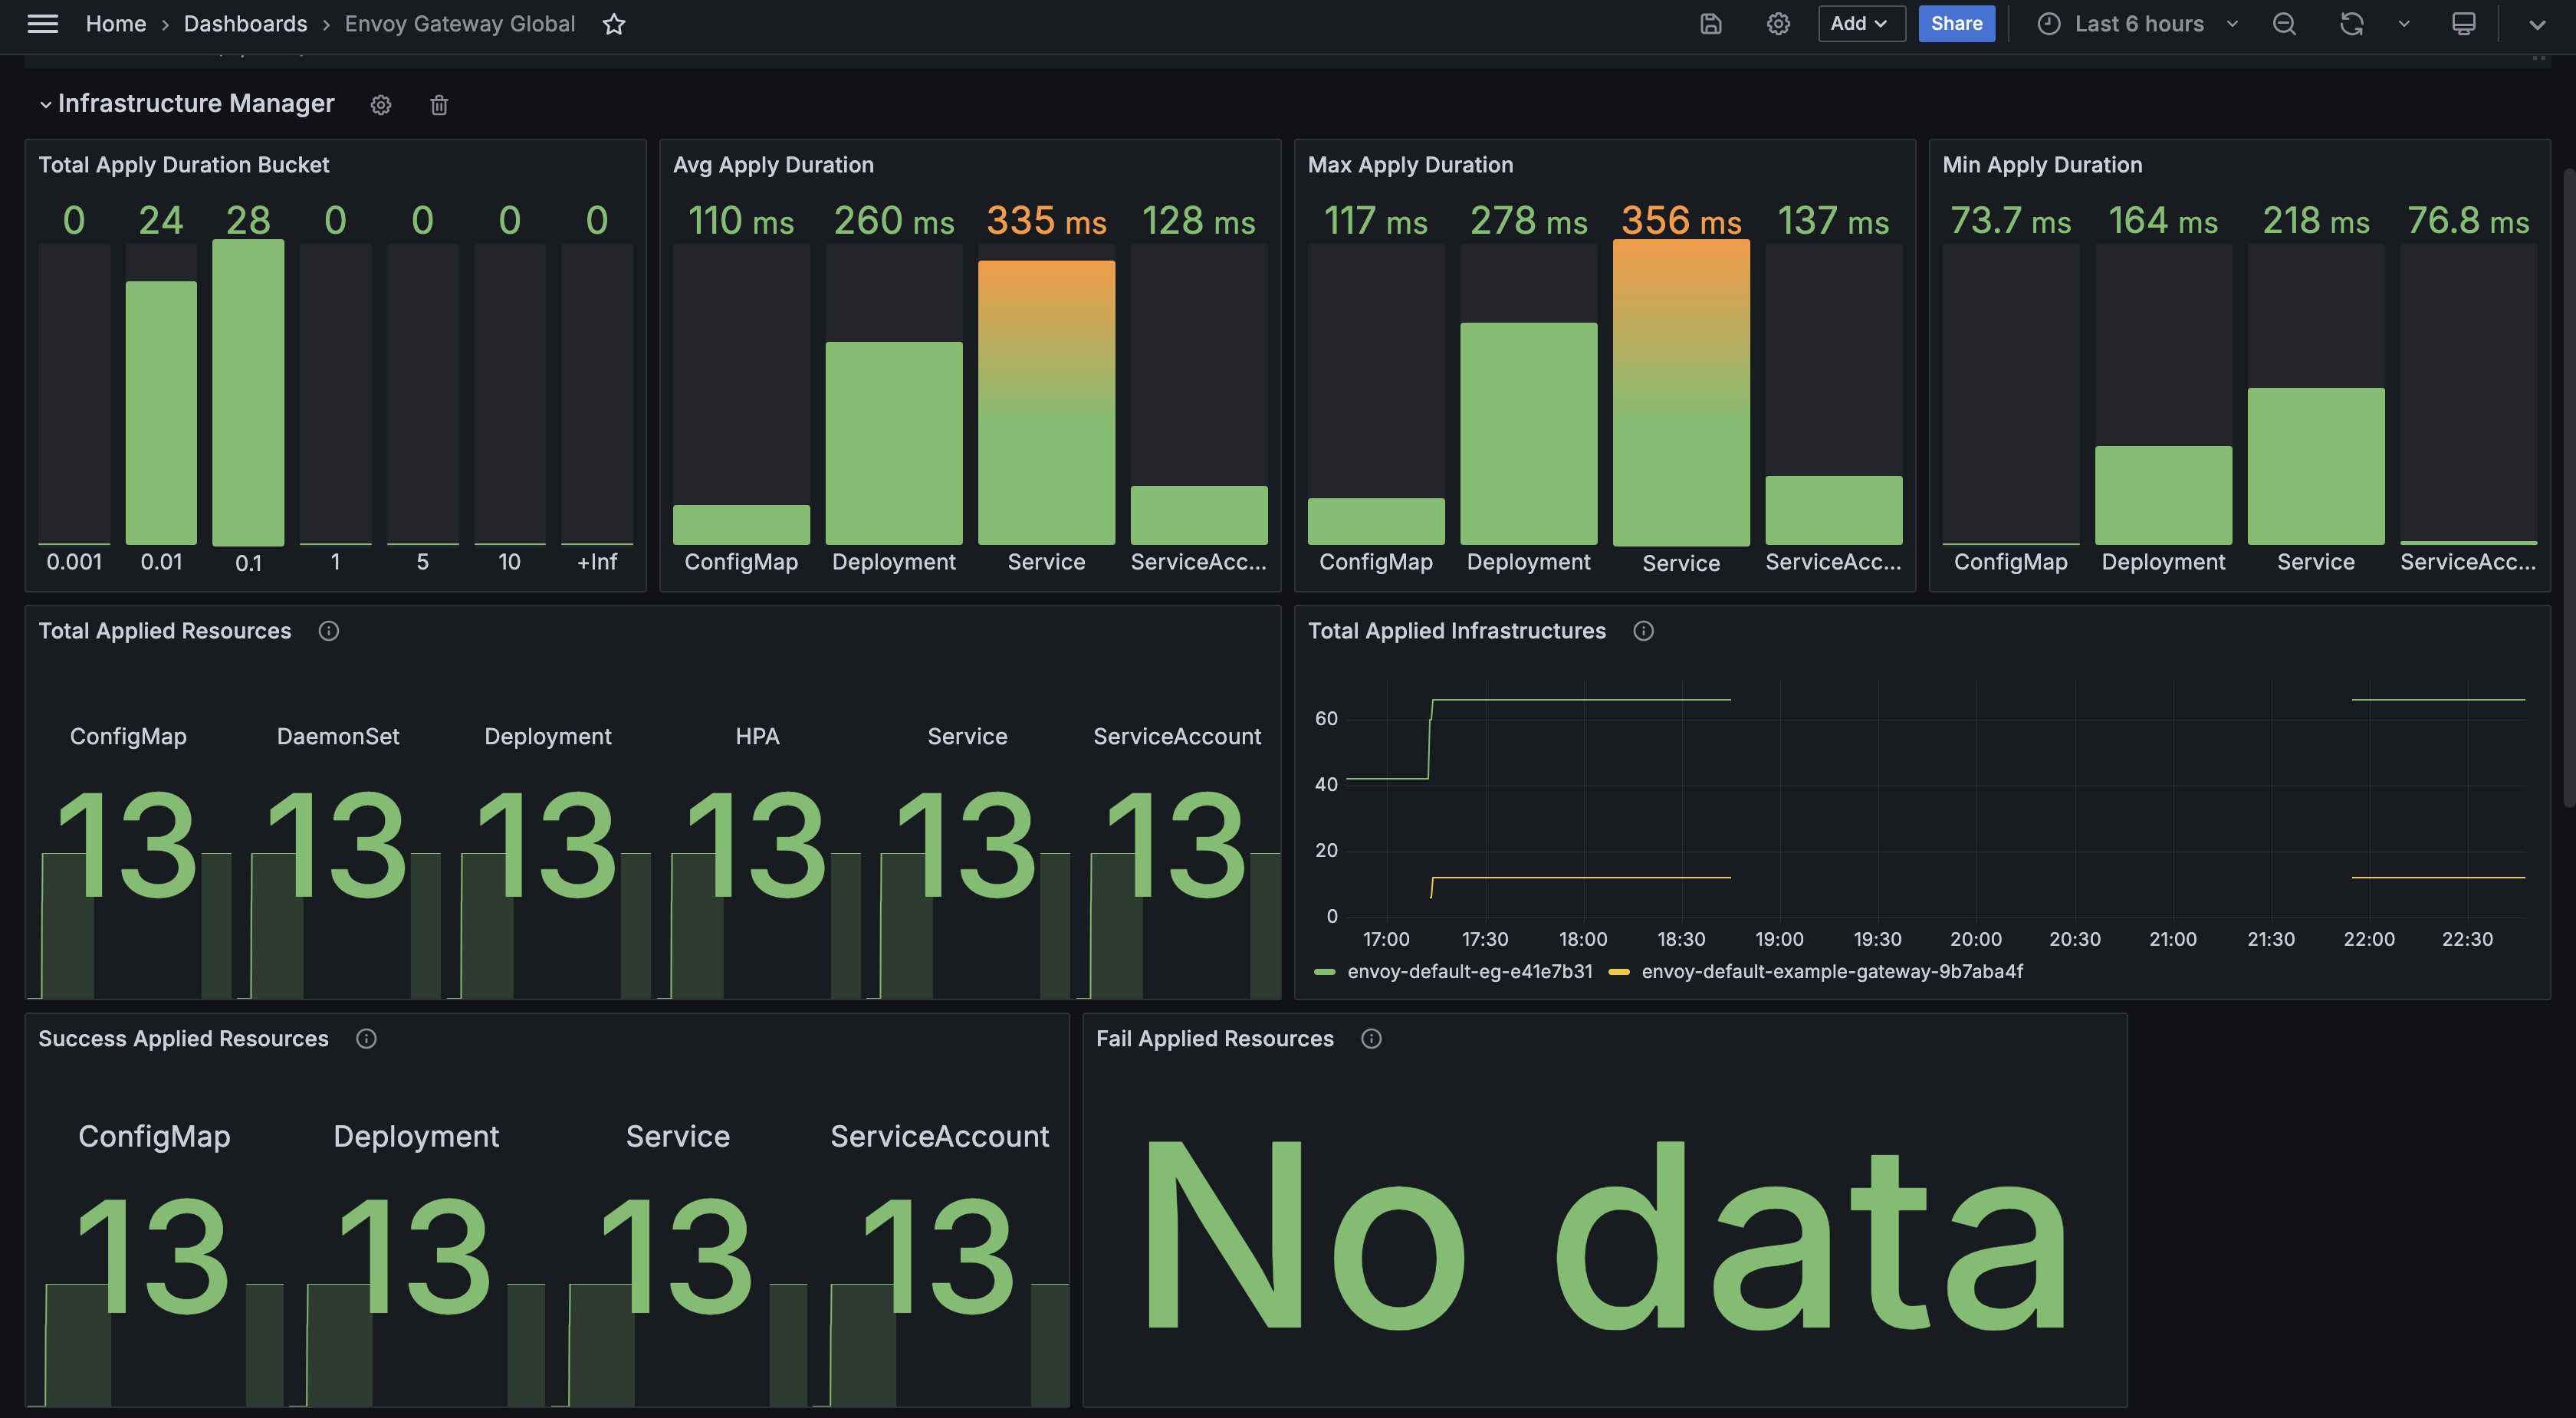
Envoy Gateway Global
This dashboard example shows the overall stats exported by Envoy Gateway fleet.
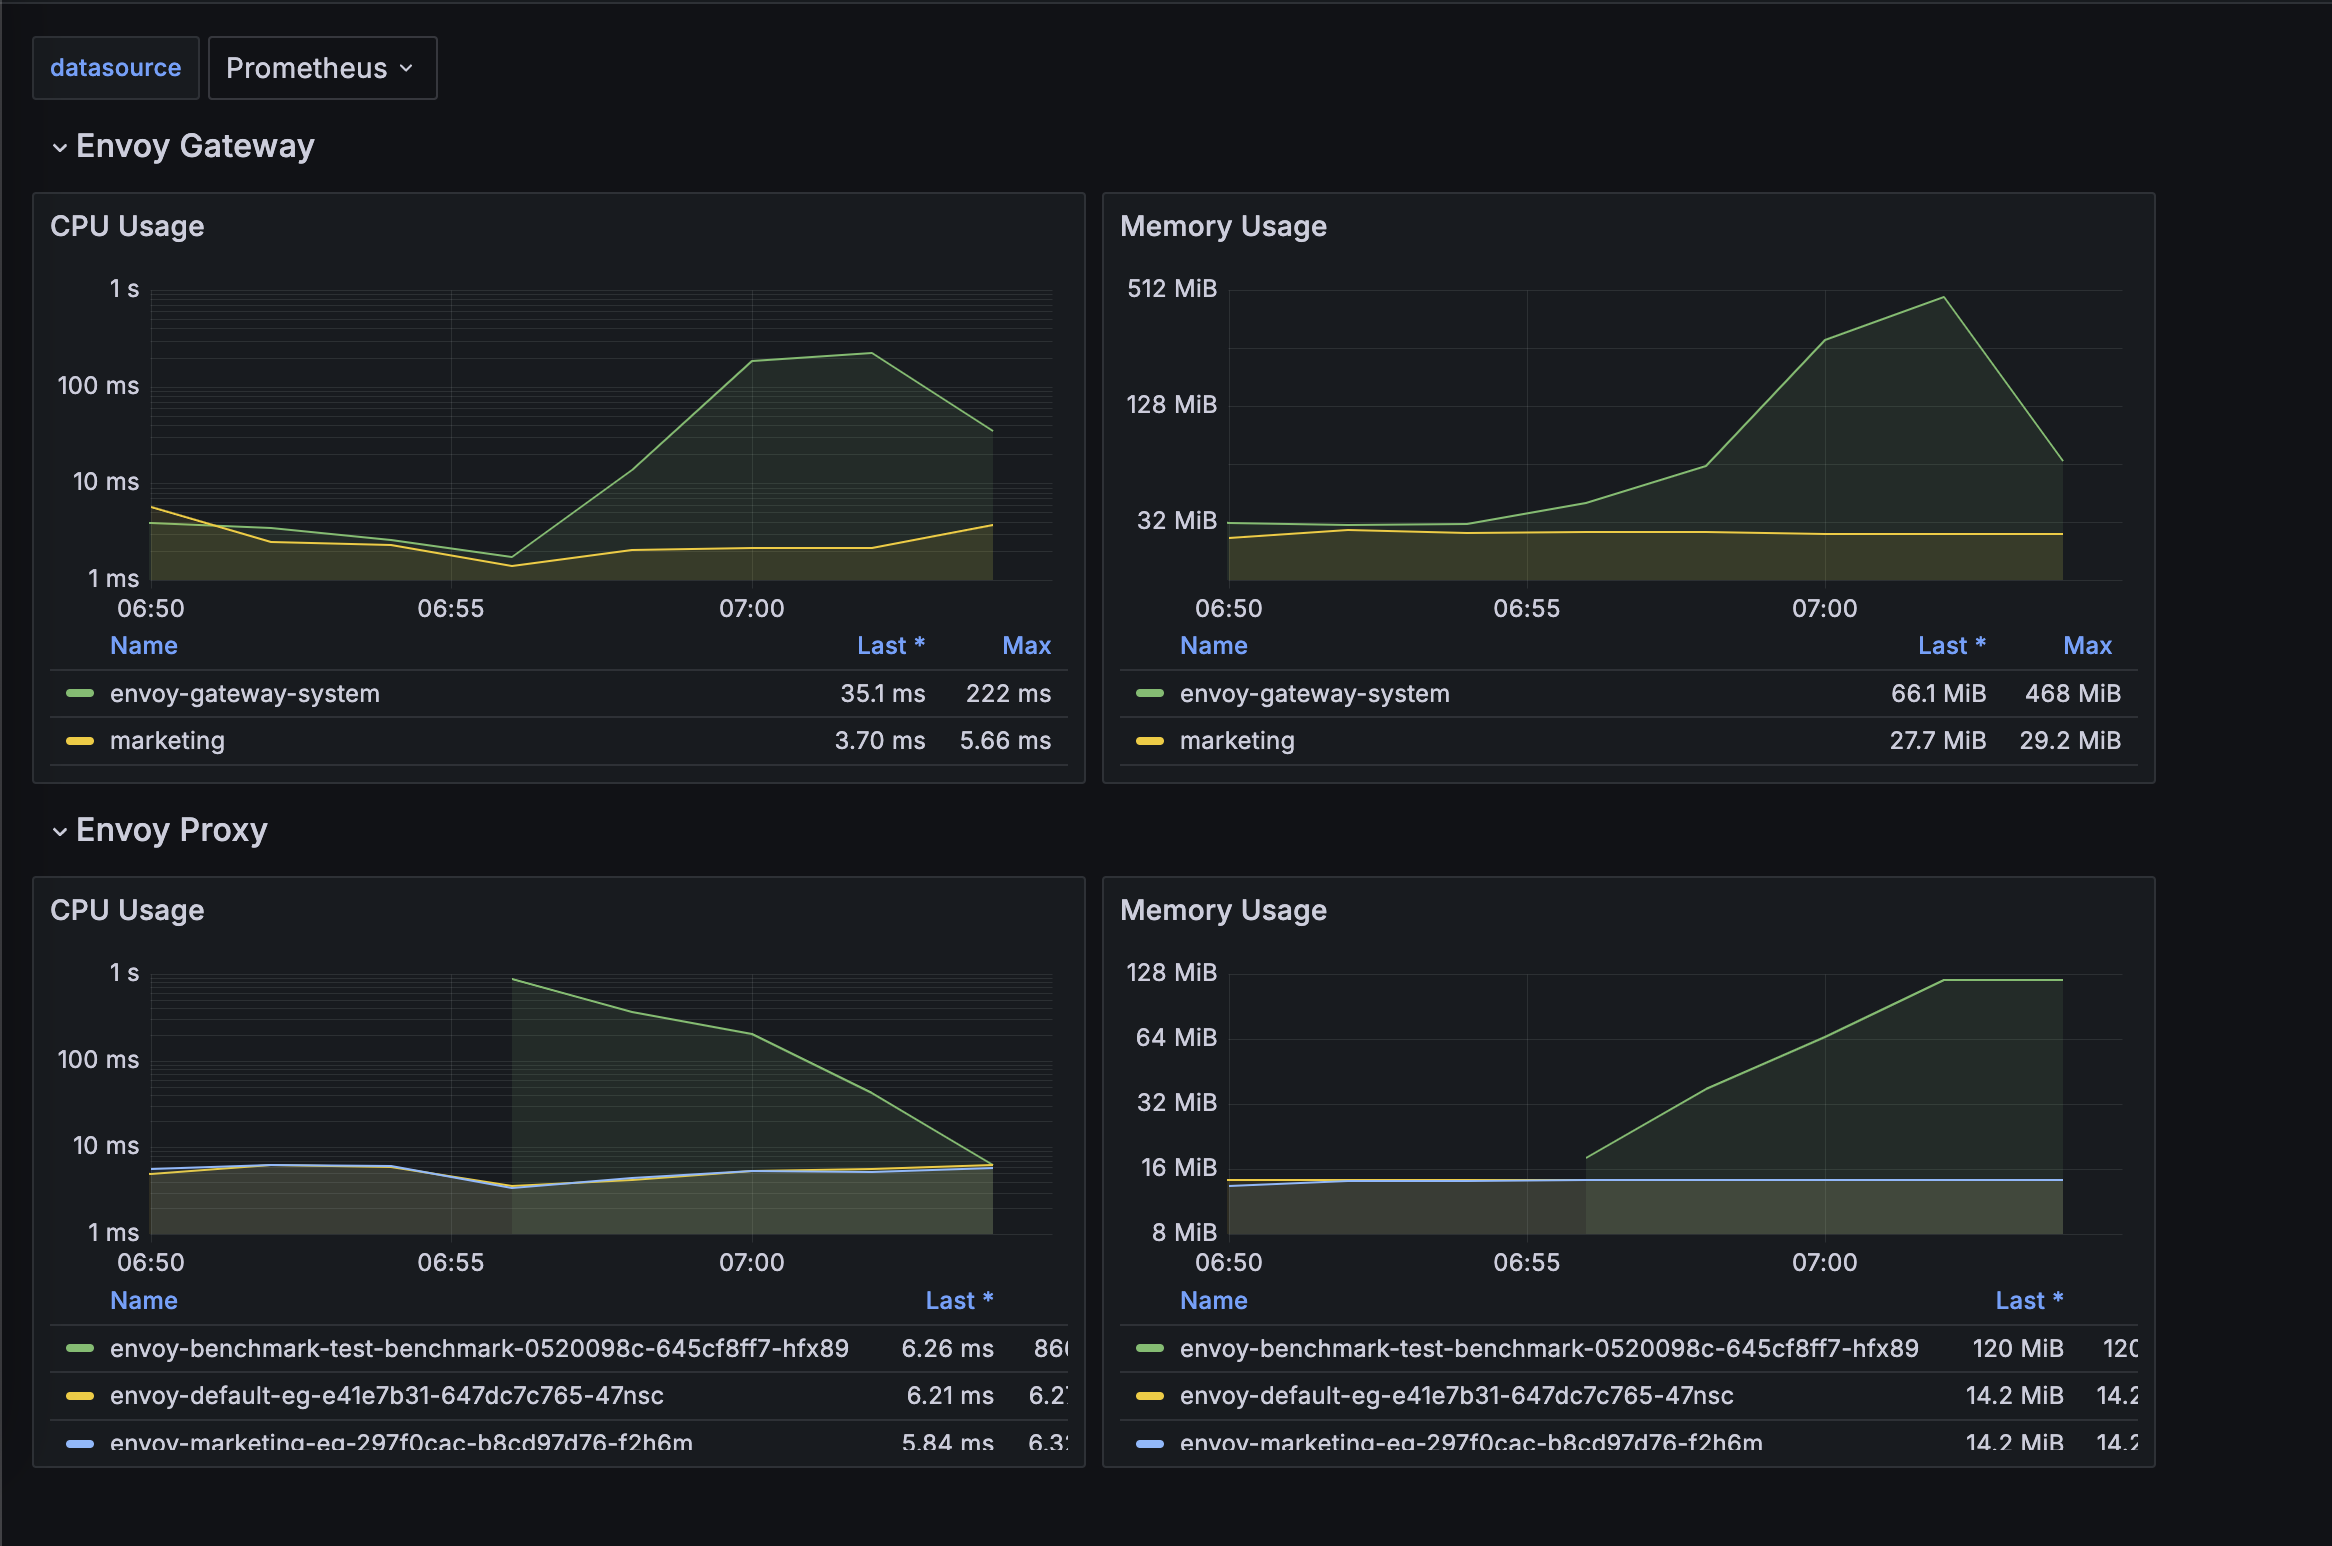
Resources Monitor
This dashboard example shows the overall resources stats for both Envoy Gateway and Envoy Proxy fleet.
Update Dashboards
All dashboards of Envoy Gateway are maintained under charts/gateway-addons-helm/dashboards,
feel free to make contributions.
Grafonnet
Newer dashboards are generated with Jsonnet with the Grafonnet. This is the preferred method for any new dashboards.
You can run make helm-generate.gateway-addons-helm to generate new version of dashboards.
All the generated dashboards have a .gen.json suffix.
Legacy Dashboards
Many of our older dashboards are manually created in the UI and exported as JSON and checked in.
These example dashboards cannot be updated in-place by default, if you are trying to make some changes to the older dashboards, you can save them directly as a JSON file and then re-import.