This is the multi-page printable view of this section. Click here to print.
Troubleshooting
1 - Admin Console
Envoy Gateway provides a built-in web-based admin console that offers a comprehensive interface for monitoring, debugging, and managing your Envoy Gateway deployment. The admin console provides real-time visibility into the control plane status, configuration state, performance metrics, and debugging capabilities.
Prerequisites
Follow the steps below to install Envoy Gateway and the example manifest. Before proceeding, you should be able to query the example backend using HTTP.
Expand for instructions
Install the Gateway API CRDs and Envoy Gateway using Helm:
helm install eg oci://docker.io/envoyproxy/gateway-helm --version v1.7.1 -n envoy-gateway-system --create-namespaceInstall the GatewayClass, Gateway, HTTPRoute and example app:
kubectl apply -f https://github.com/envoyproxy/gateway/releases/download/v1.7.1/quickstart.yaml -n defaultVerify Connectivity:
Get the External IP of the Gateway:
export GATEWAY_HOST=$(kubectl get gateway/eg -o jsonpath='{.status.addresses[0].value}')Curl the example app through Envoy proxy:
curl --verbose --header "Host: www.example.com" http://$GATEWAY_HOST/getThe above command should succeed with status code 200.
Get the name of the Envoy service created the by the example Gateway:
export ENVOY_SERVICE=$(kubectl get svc -n envoy-gateway-system --selector=gateway.envoyproxy.io/owning-gateway-namespace=default,gateway.envoyproxy.io/owning-gateway-name=eg -o jsonpath='{.items[0].metadata.name}')Get the deployment of the Envoy service created the by the example Gateway:
export ENVOY_DEPLOYMENT=$(kubectl get deploy -n envoy-gateway-system --selector=gateway.envoyproxy.io/owning-gateway-namespace=default,gateway.envoyproxy.io/owning-gateway-name=eg -o jsonpath='{.items[0].metadata.name}')Port forward to the Envoy service:
kubectl -n envoy-gateway-system port-forward service/${ENVOY_SERVICE} 8888:80 &Curl the example app through Envoy proxy:
curl --verbose --header "Host: www.example.com" http://localhost:8888/getThe above command should succeed with status code 200.
Overview
The admin console is automatically enabled and provides the following key features:
- Dashboard: Overview of system status and quick access to all features
- Server Information: Detailed runtime information about Envoy Gateway components
- Configuration Dump: Real-time view of Gateway API resources and their status
- Statistics: Control plane metrics in Prometheus format
- Performance Profiling: pprof endpoints for debugging and performance analysis
Accessing the Admin Console
By default, the admin console is available on localhost:19000. There are two ways to access it:
Method 1: Using kubectl port-forward
kubectl port-forward -n envoy-gateway-system deployment/envoy-gateway 19000:19000
Then open your browser and navigate to:
http://localhost:19000
Method 2: Using egctl dashboard command
You can install egctl by following the installation guide.
egctl x dashboard eg
This command will automatically set up port forwarding and open the admin console in your default browser.
Configuration
The admin console can be configured through the EnvoyGateway configuration resource:
Development Configuration
For development environments, you may want to enable additional debugging features:
apiVersion: gateway.envoyproxy.io/v1alpha1
kind: EnvoyGateway
metadata:
  name: envoy-gateway-dev
  namespace: envoy-gateway-system
spec:
  admin:
    address:
      # Allow external access (use with caution)
      host: "0.0.0.0"
      port: 19000

    # Enable pprof for performance debugging
    enablePprof: true
Production Configuration
For production environments, use more restrictive settings:
apiVersion: gateway.envoyproxy.io/v1alpha1
kind: EnvoyGateway
metadata:
  name: envoy-gateway-prod
  namespace: envoy-gateway-system
spec:
  admin:
    address:
      # Localhost only for security
      host: "127.0.0.1"
      port: 19000

    # Disable pprof in production
    enablePprof: false
Features
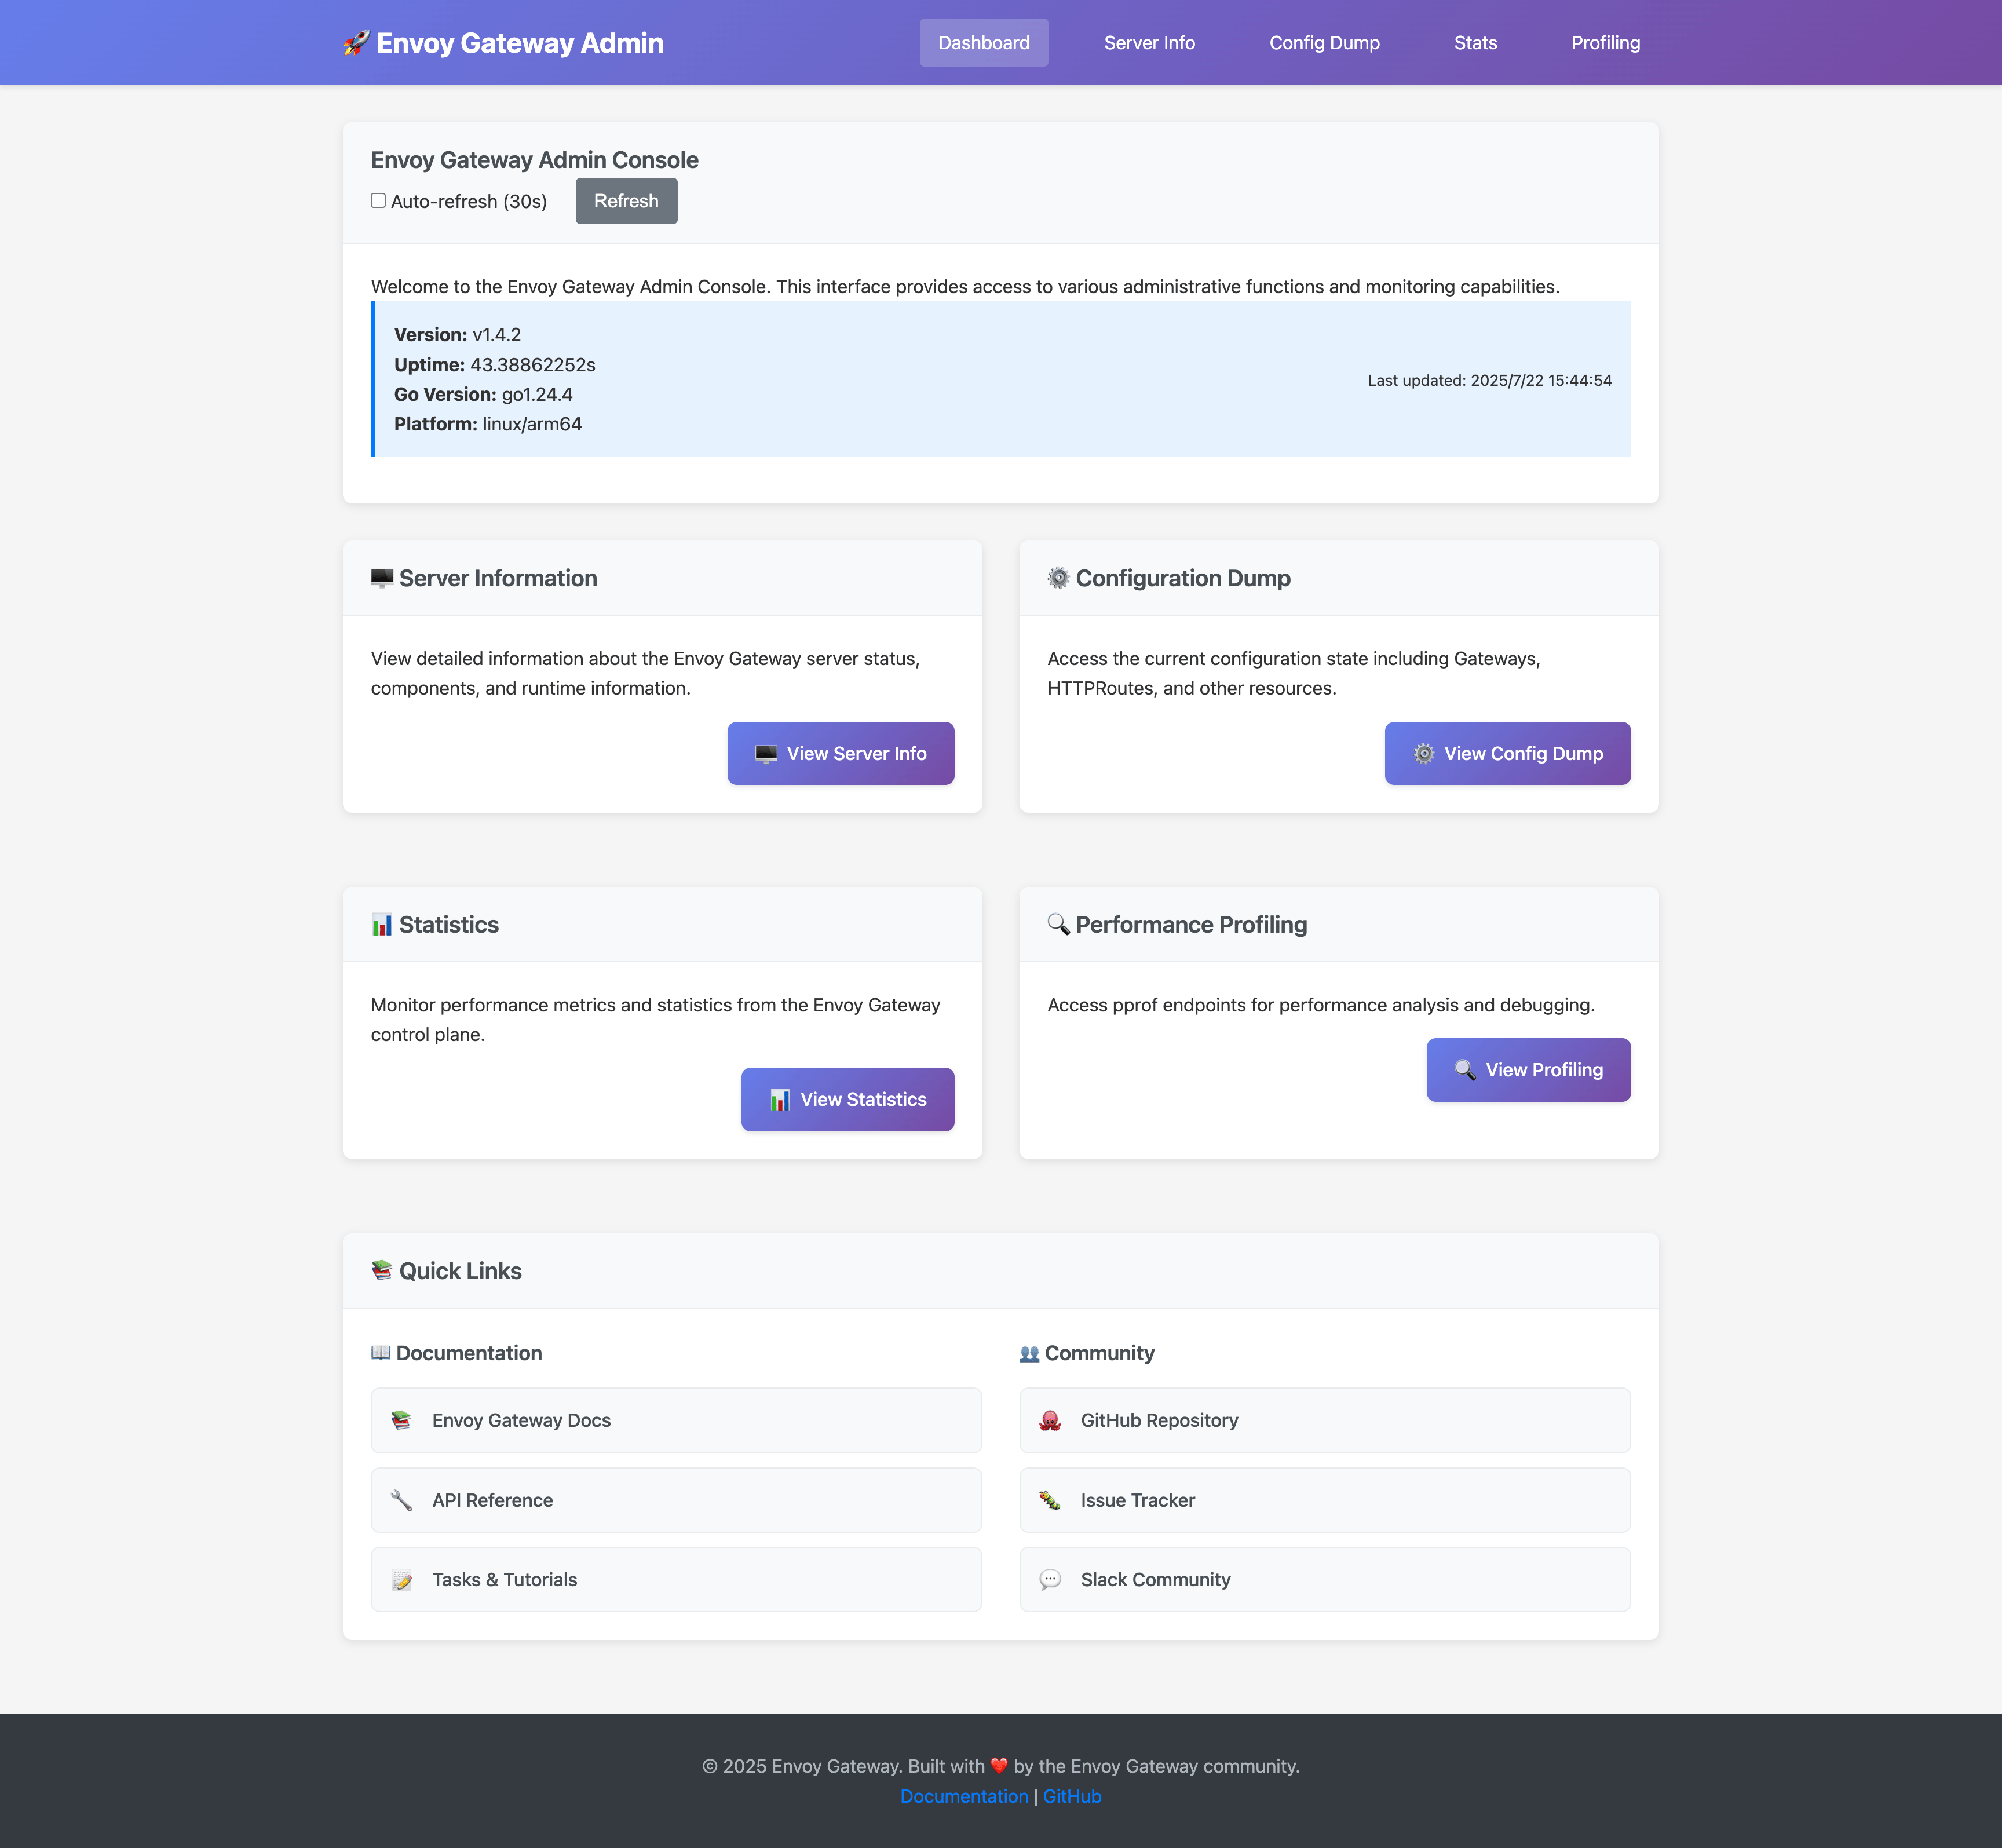
Dashboard
The main dashboard provides:
- System Information: Version, uptime, and platform details
- Component Status: Real-time status of all Envoy Gateway components
- Quick Navigation: Easy access to all admin console features
- Auto-refresh: Automatic updates every 30 seconds
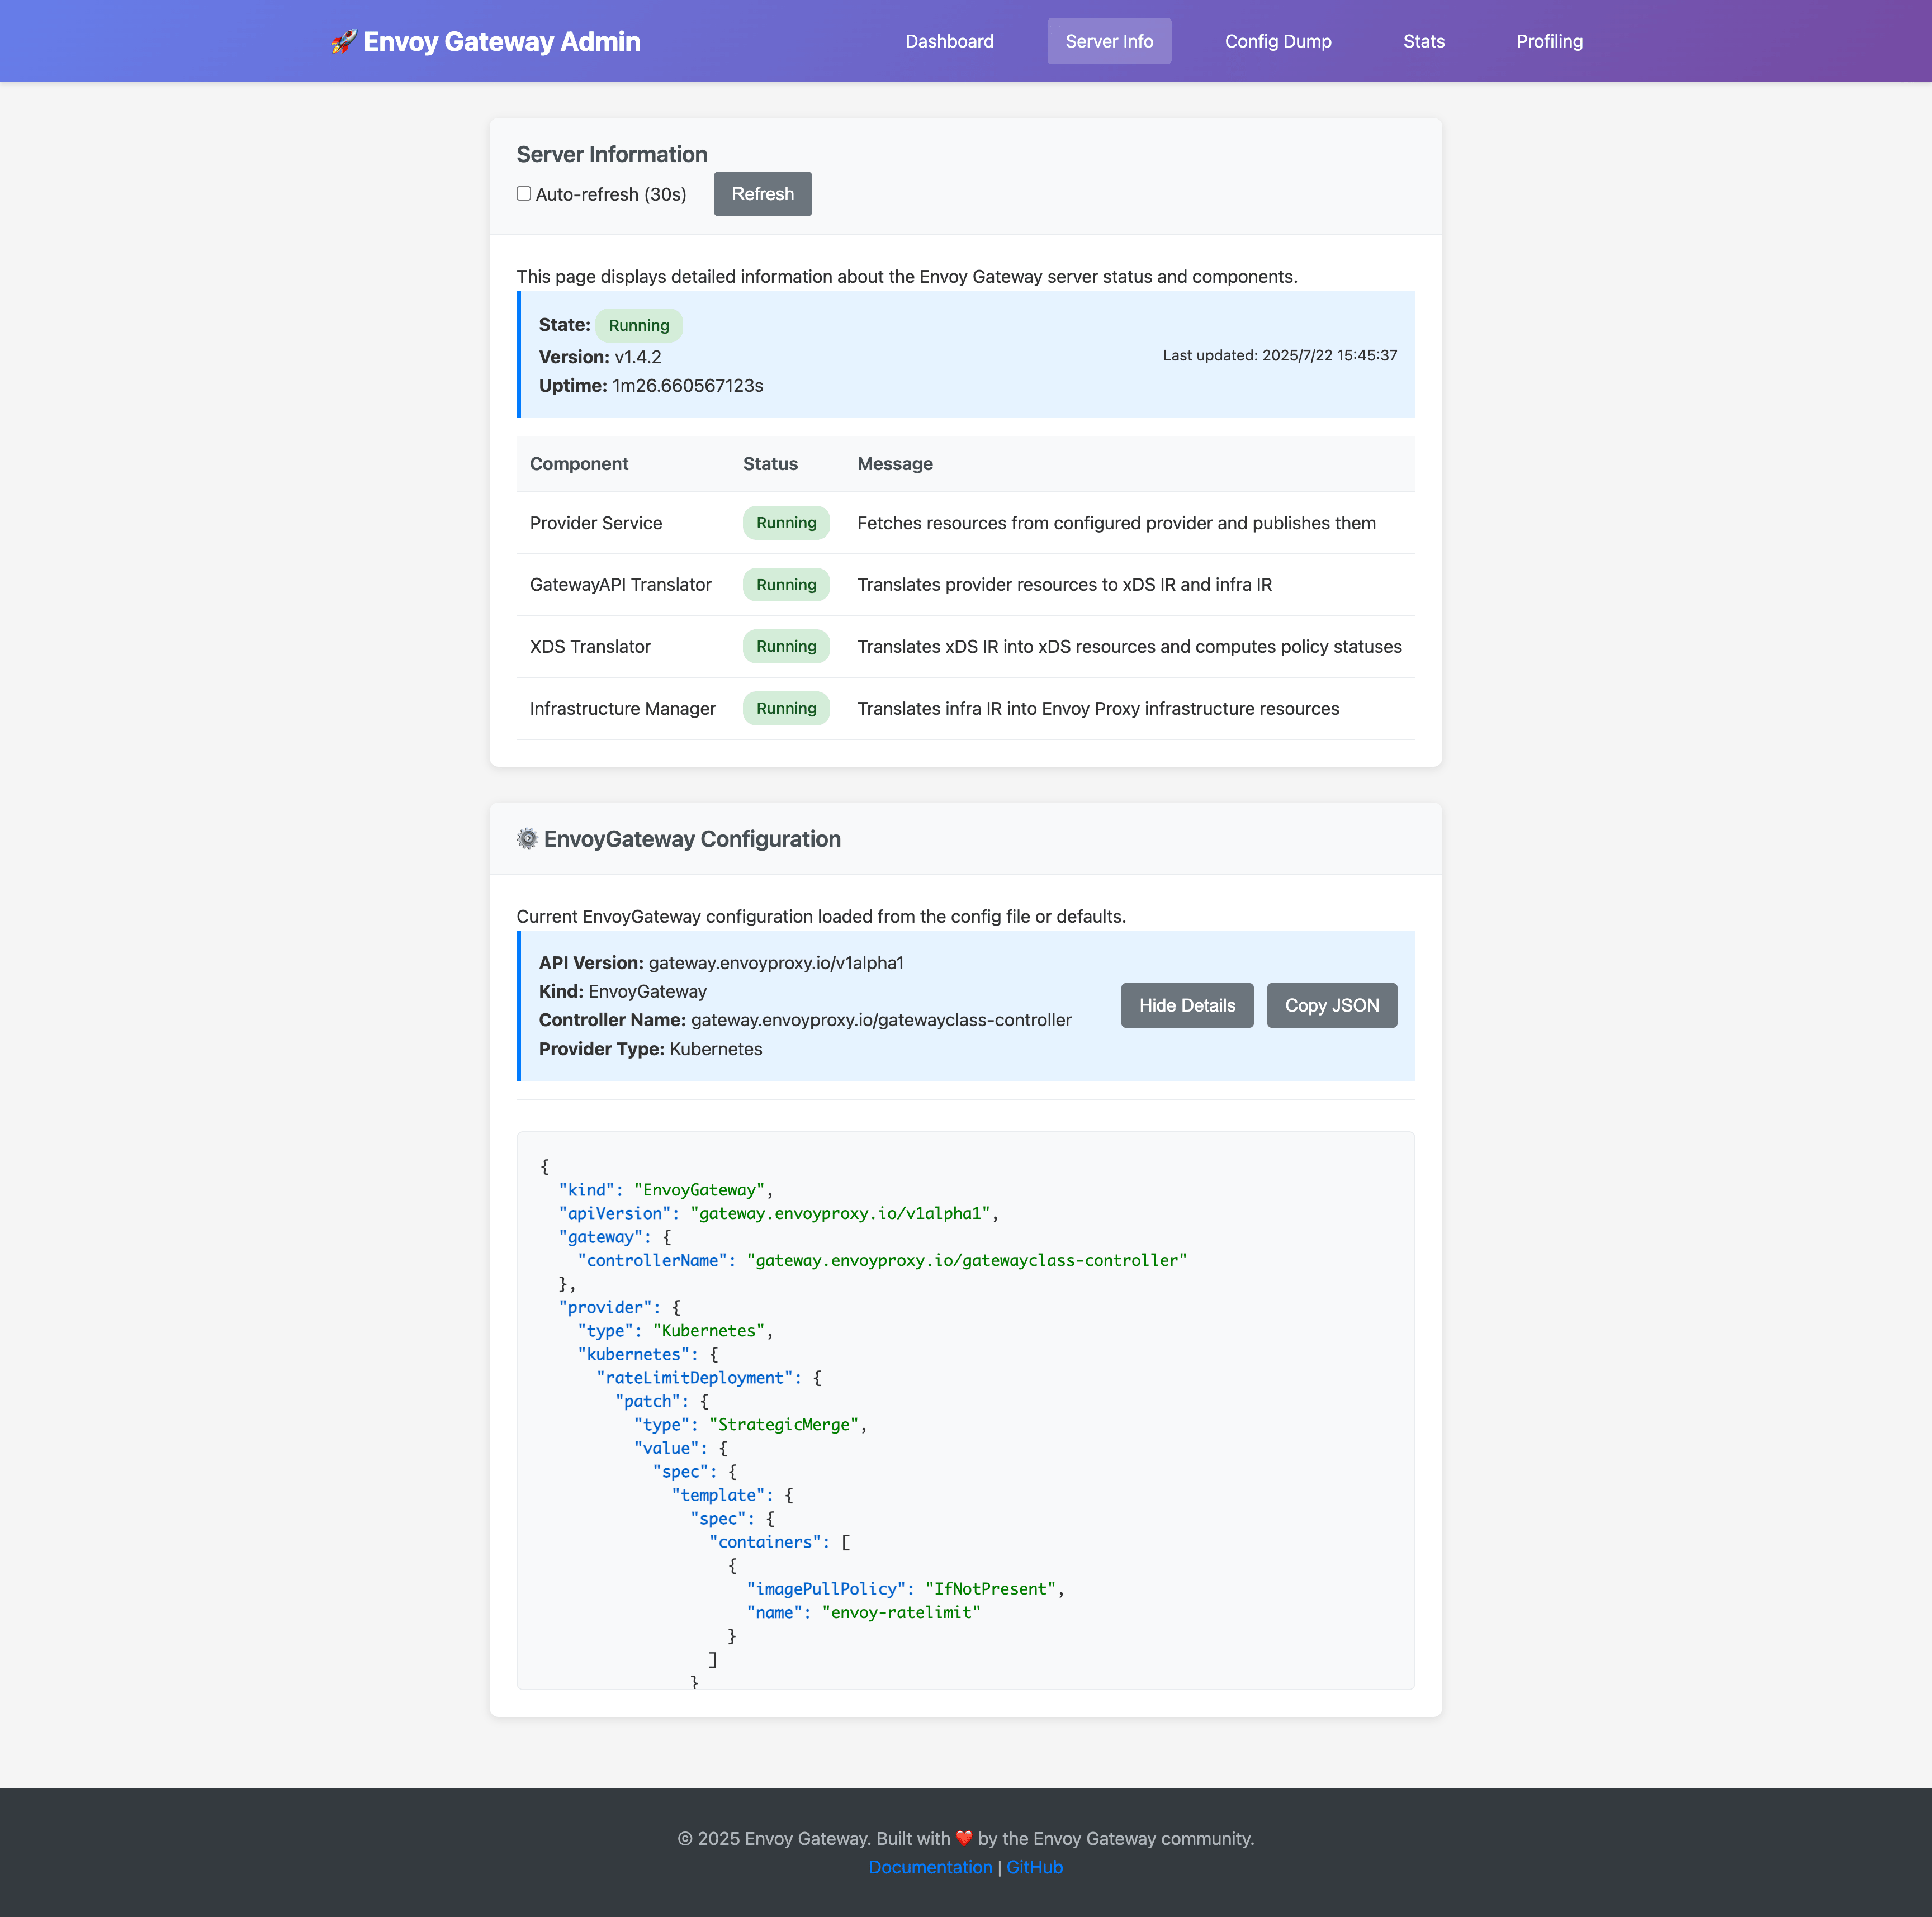
Server Information
The server info page displays:
- Component Health: Status of Provider Service, GatewayAPI Translator, xDS Translator, and Infrastructure Manager
- Runtime Details: Version information, uptime, and system metrics
- Configuration: Current EnvoyGateway configuration settings
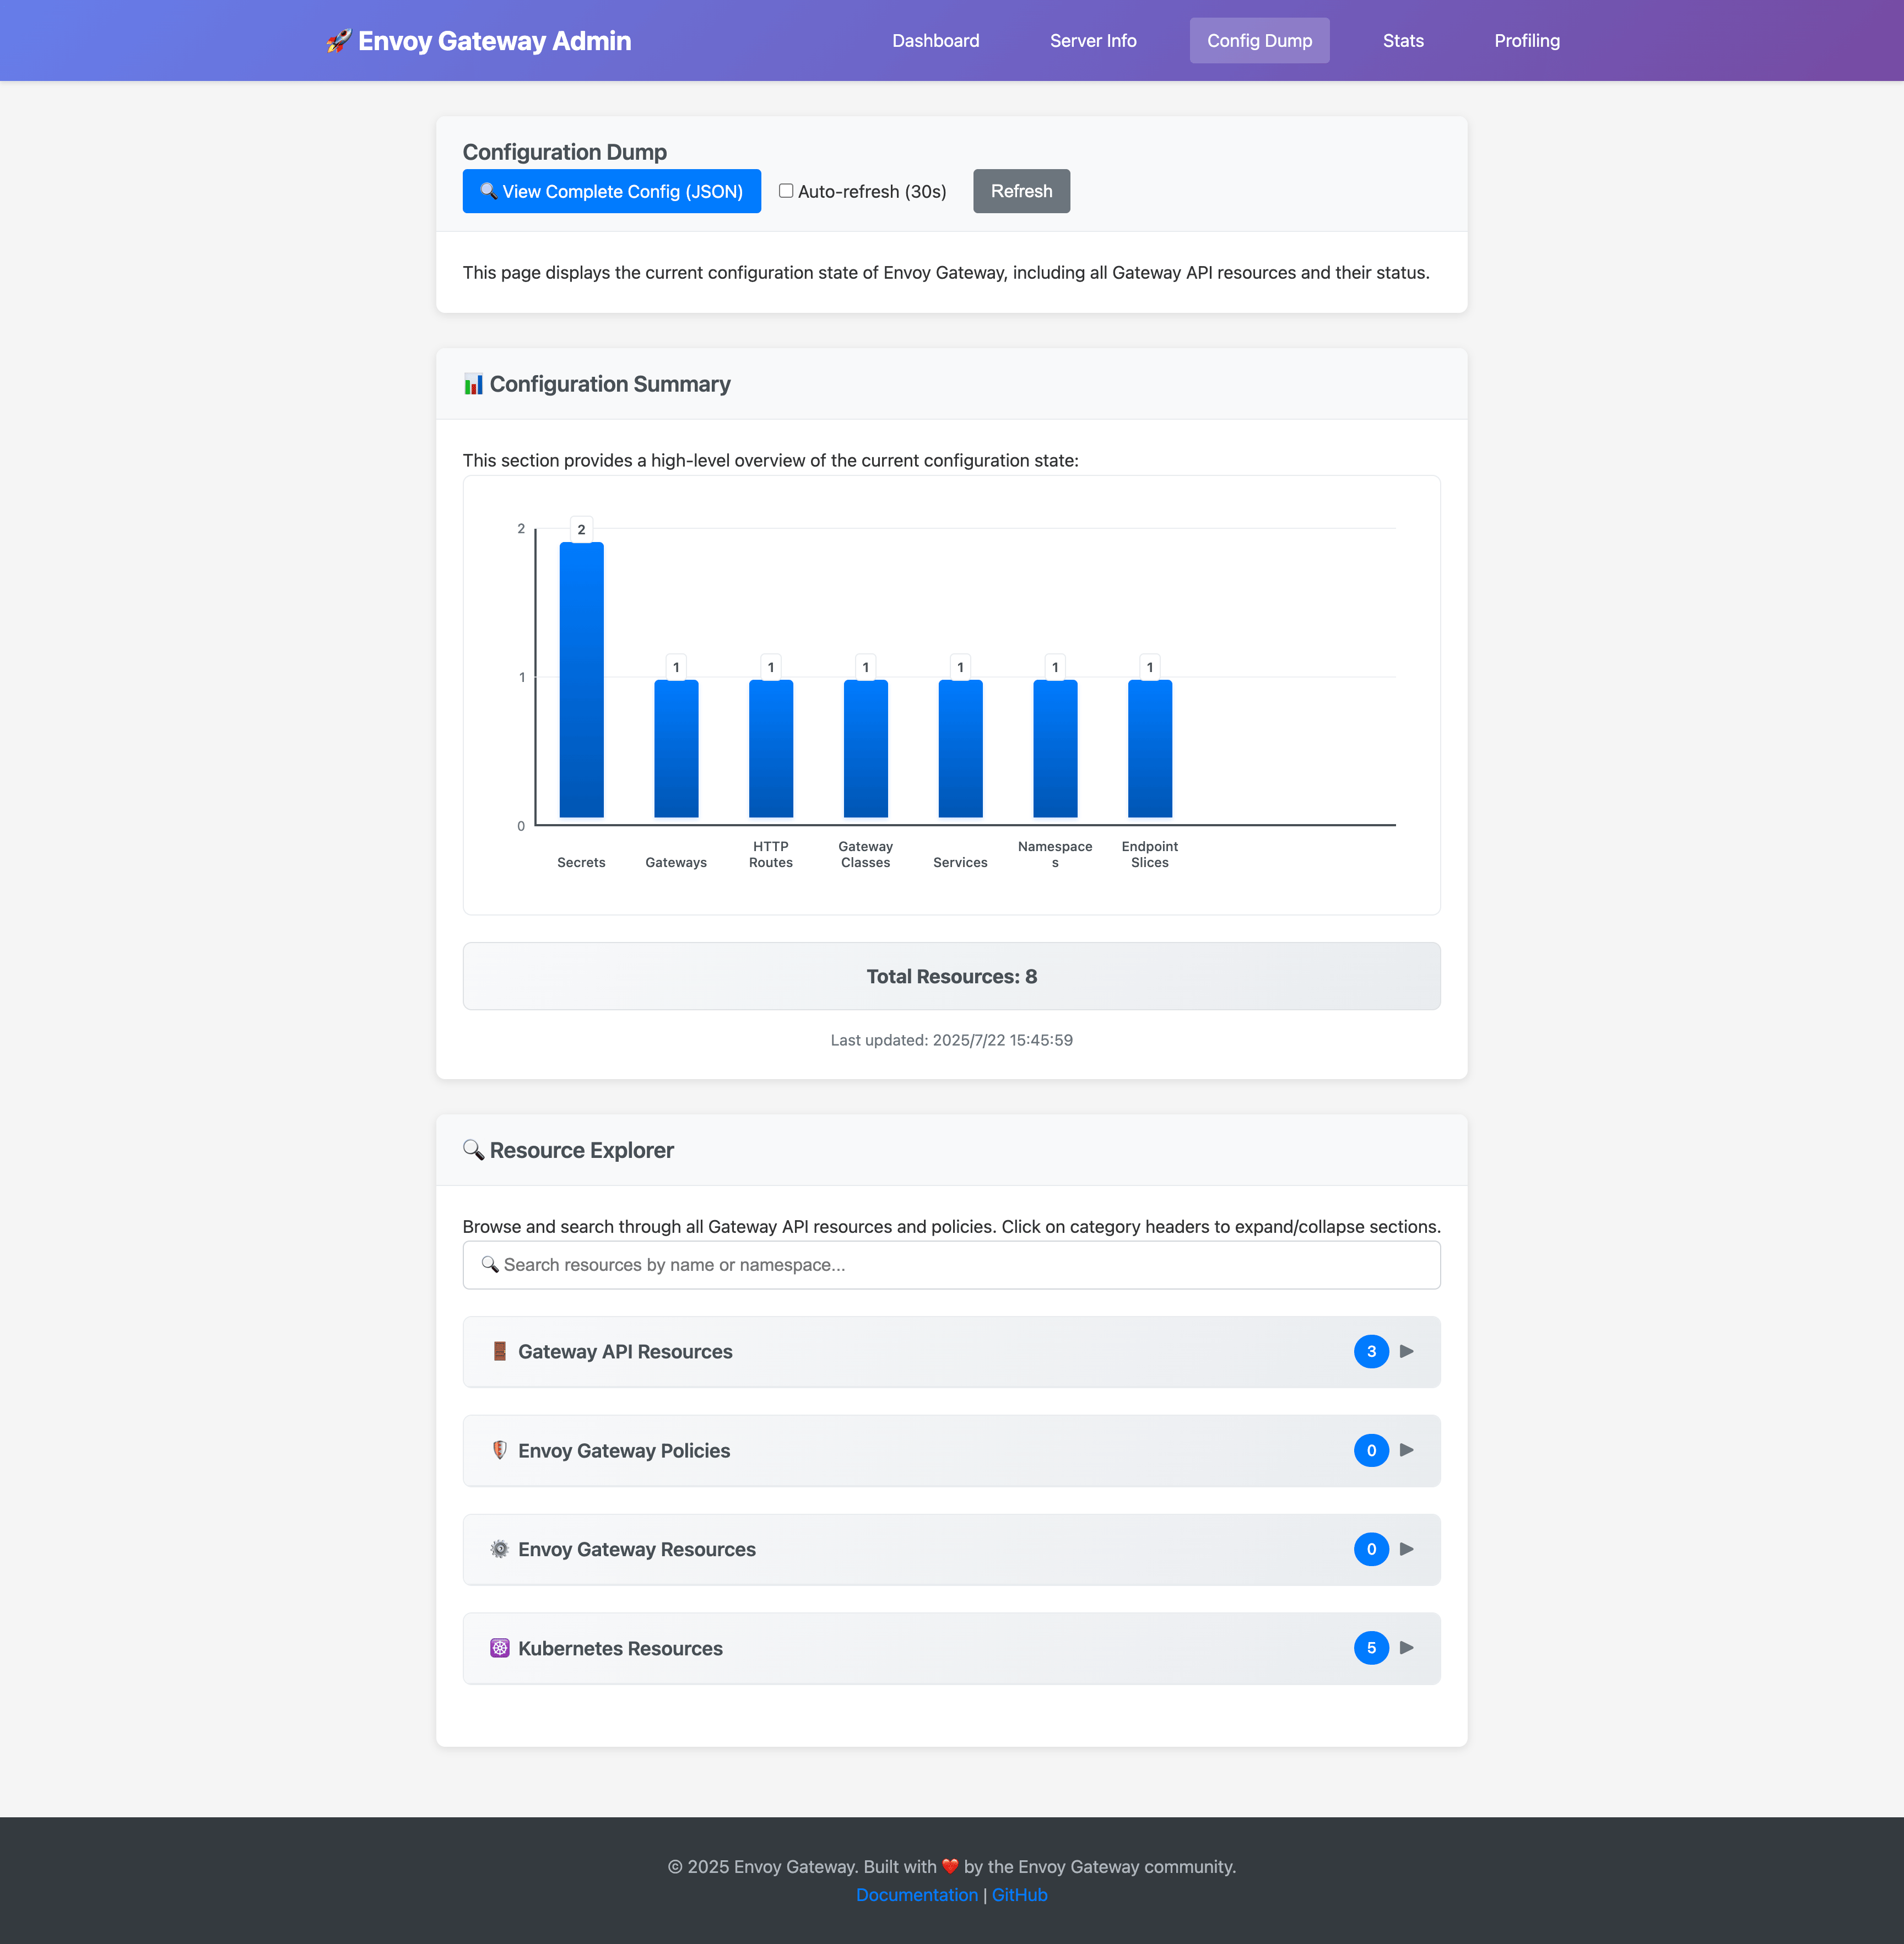
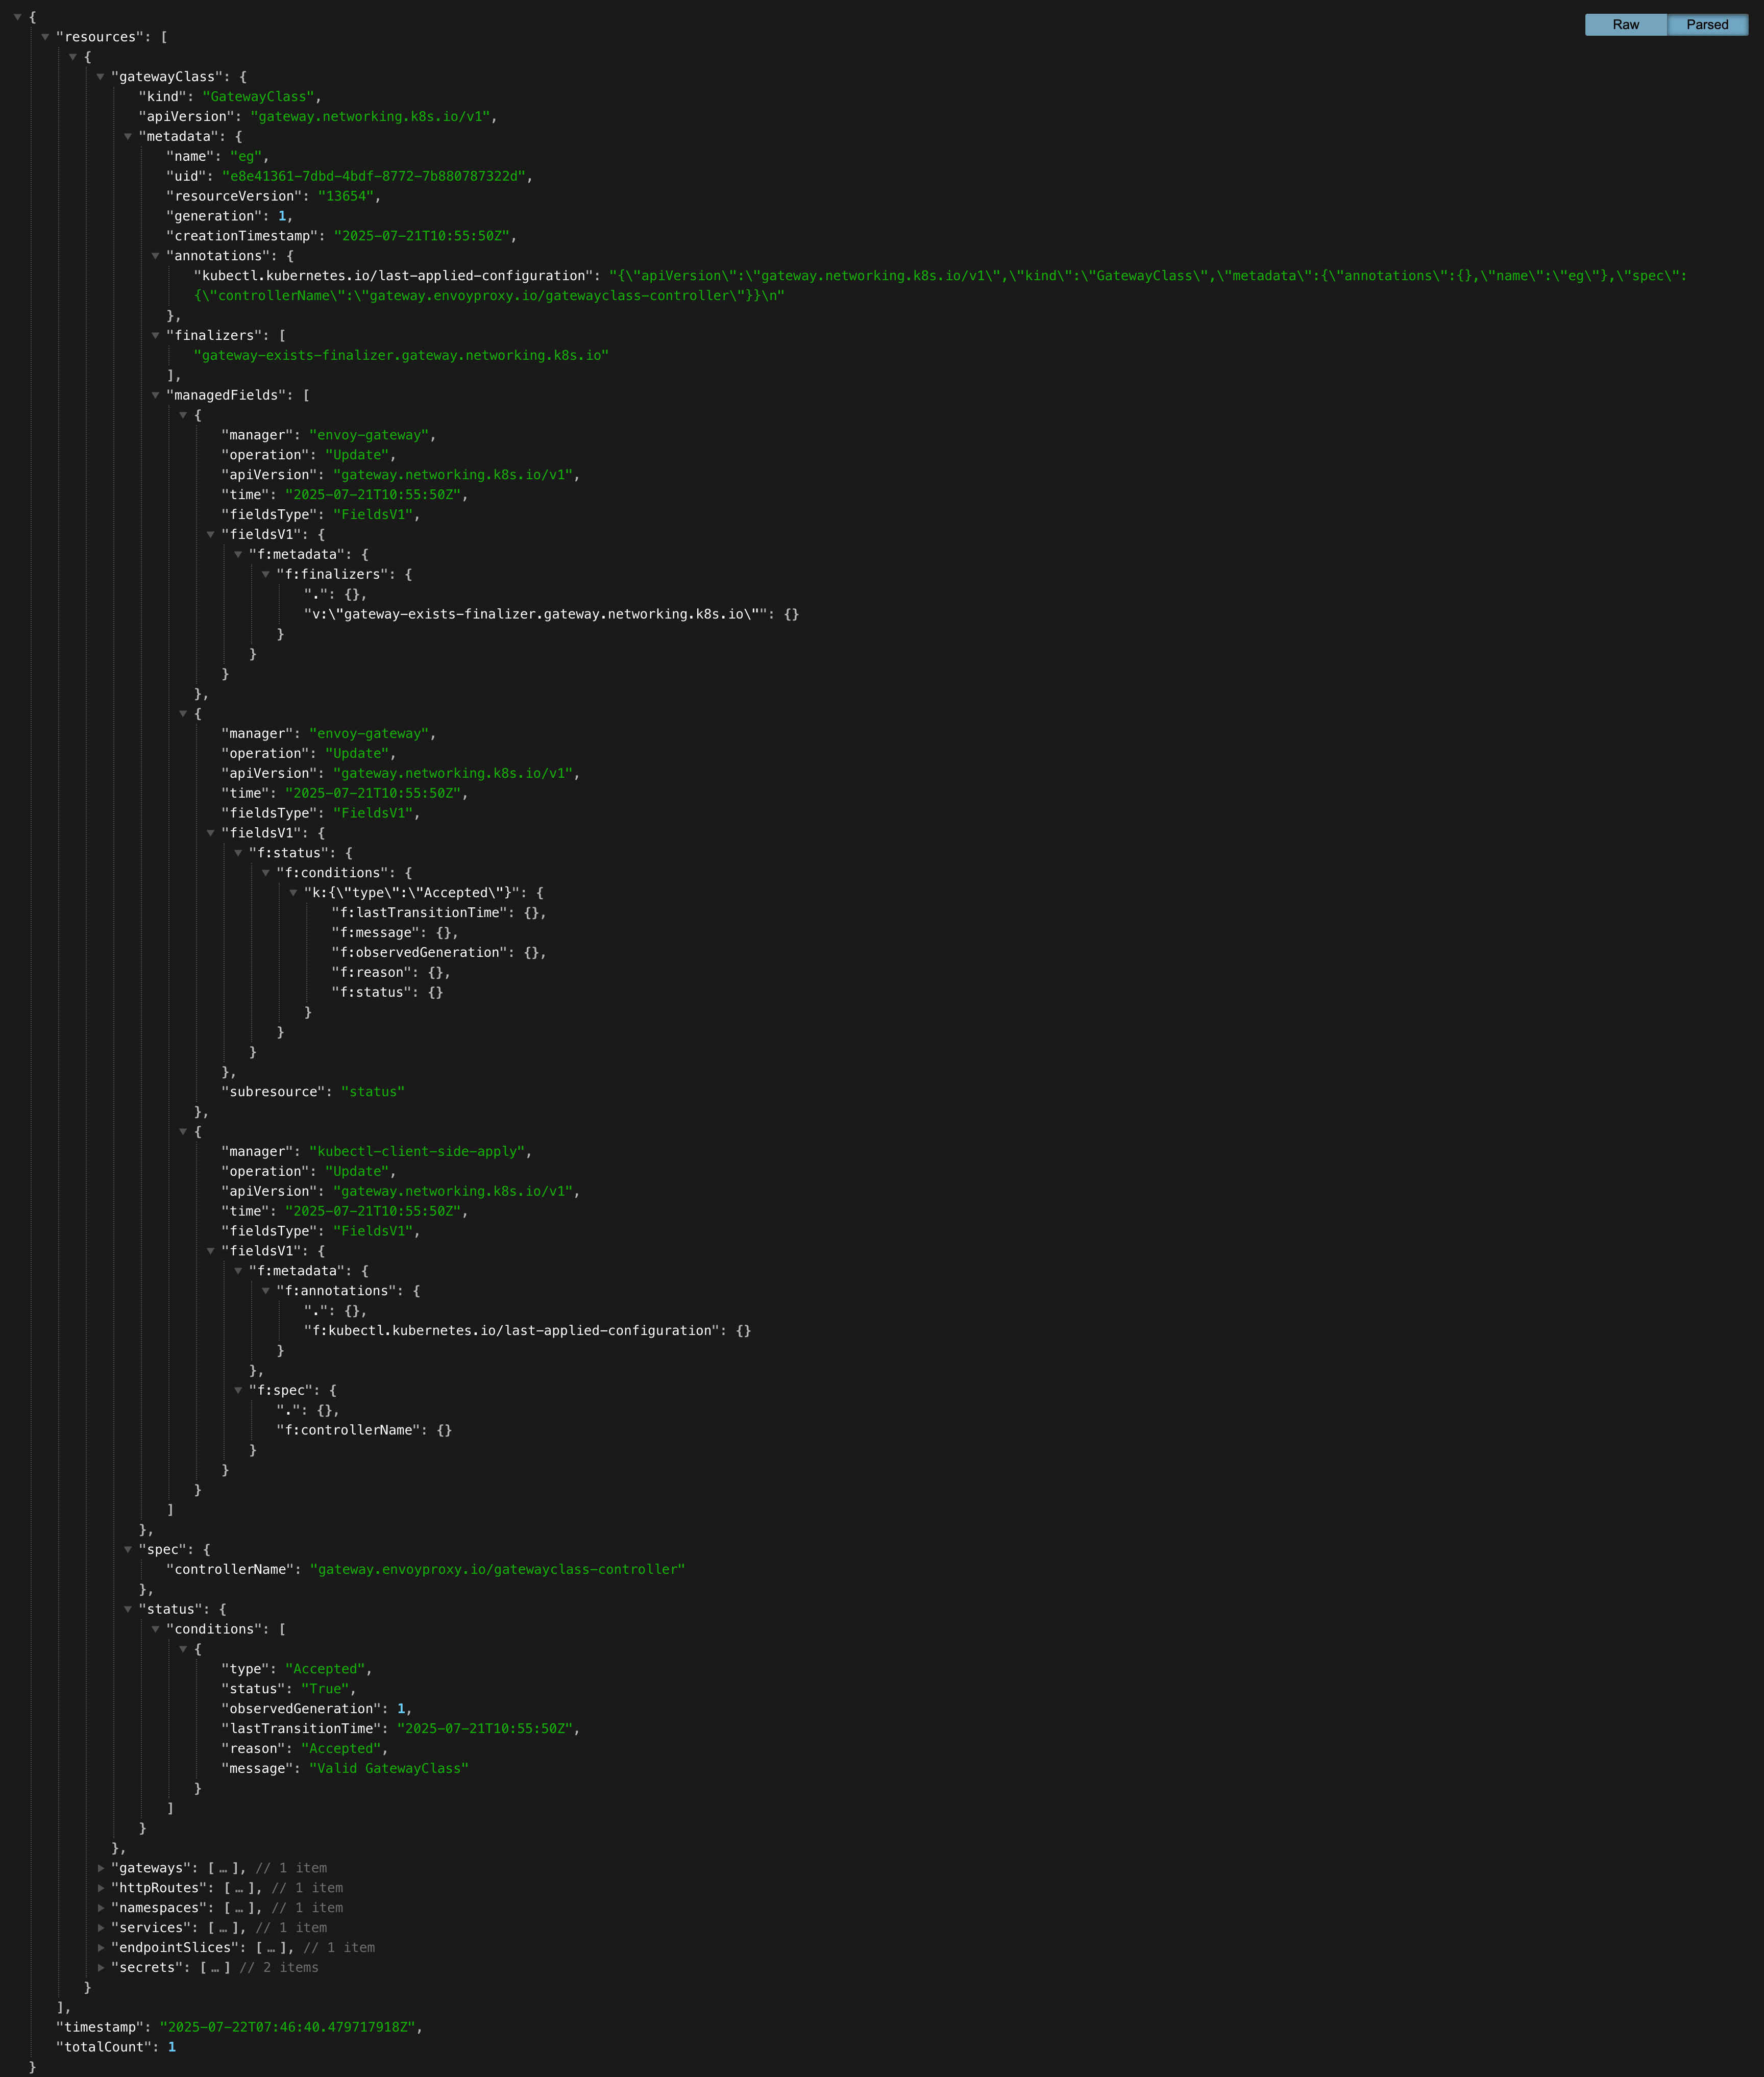
Configuration Dump
The config dump feature provides:
- Resource Explorer: Browse all Gateway API resources (Gateways, HTTPRoutes, etc.)
- Search Functionality: Find resources by name or namespace
- Real-time Updates: Live view of configuration changes
- JSON Export: Download complete configuration as JSON
The search functionality allows you to quickly find specific resources:
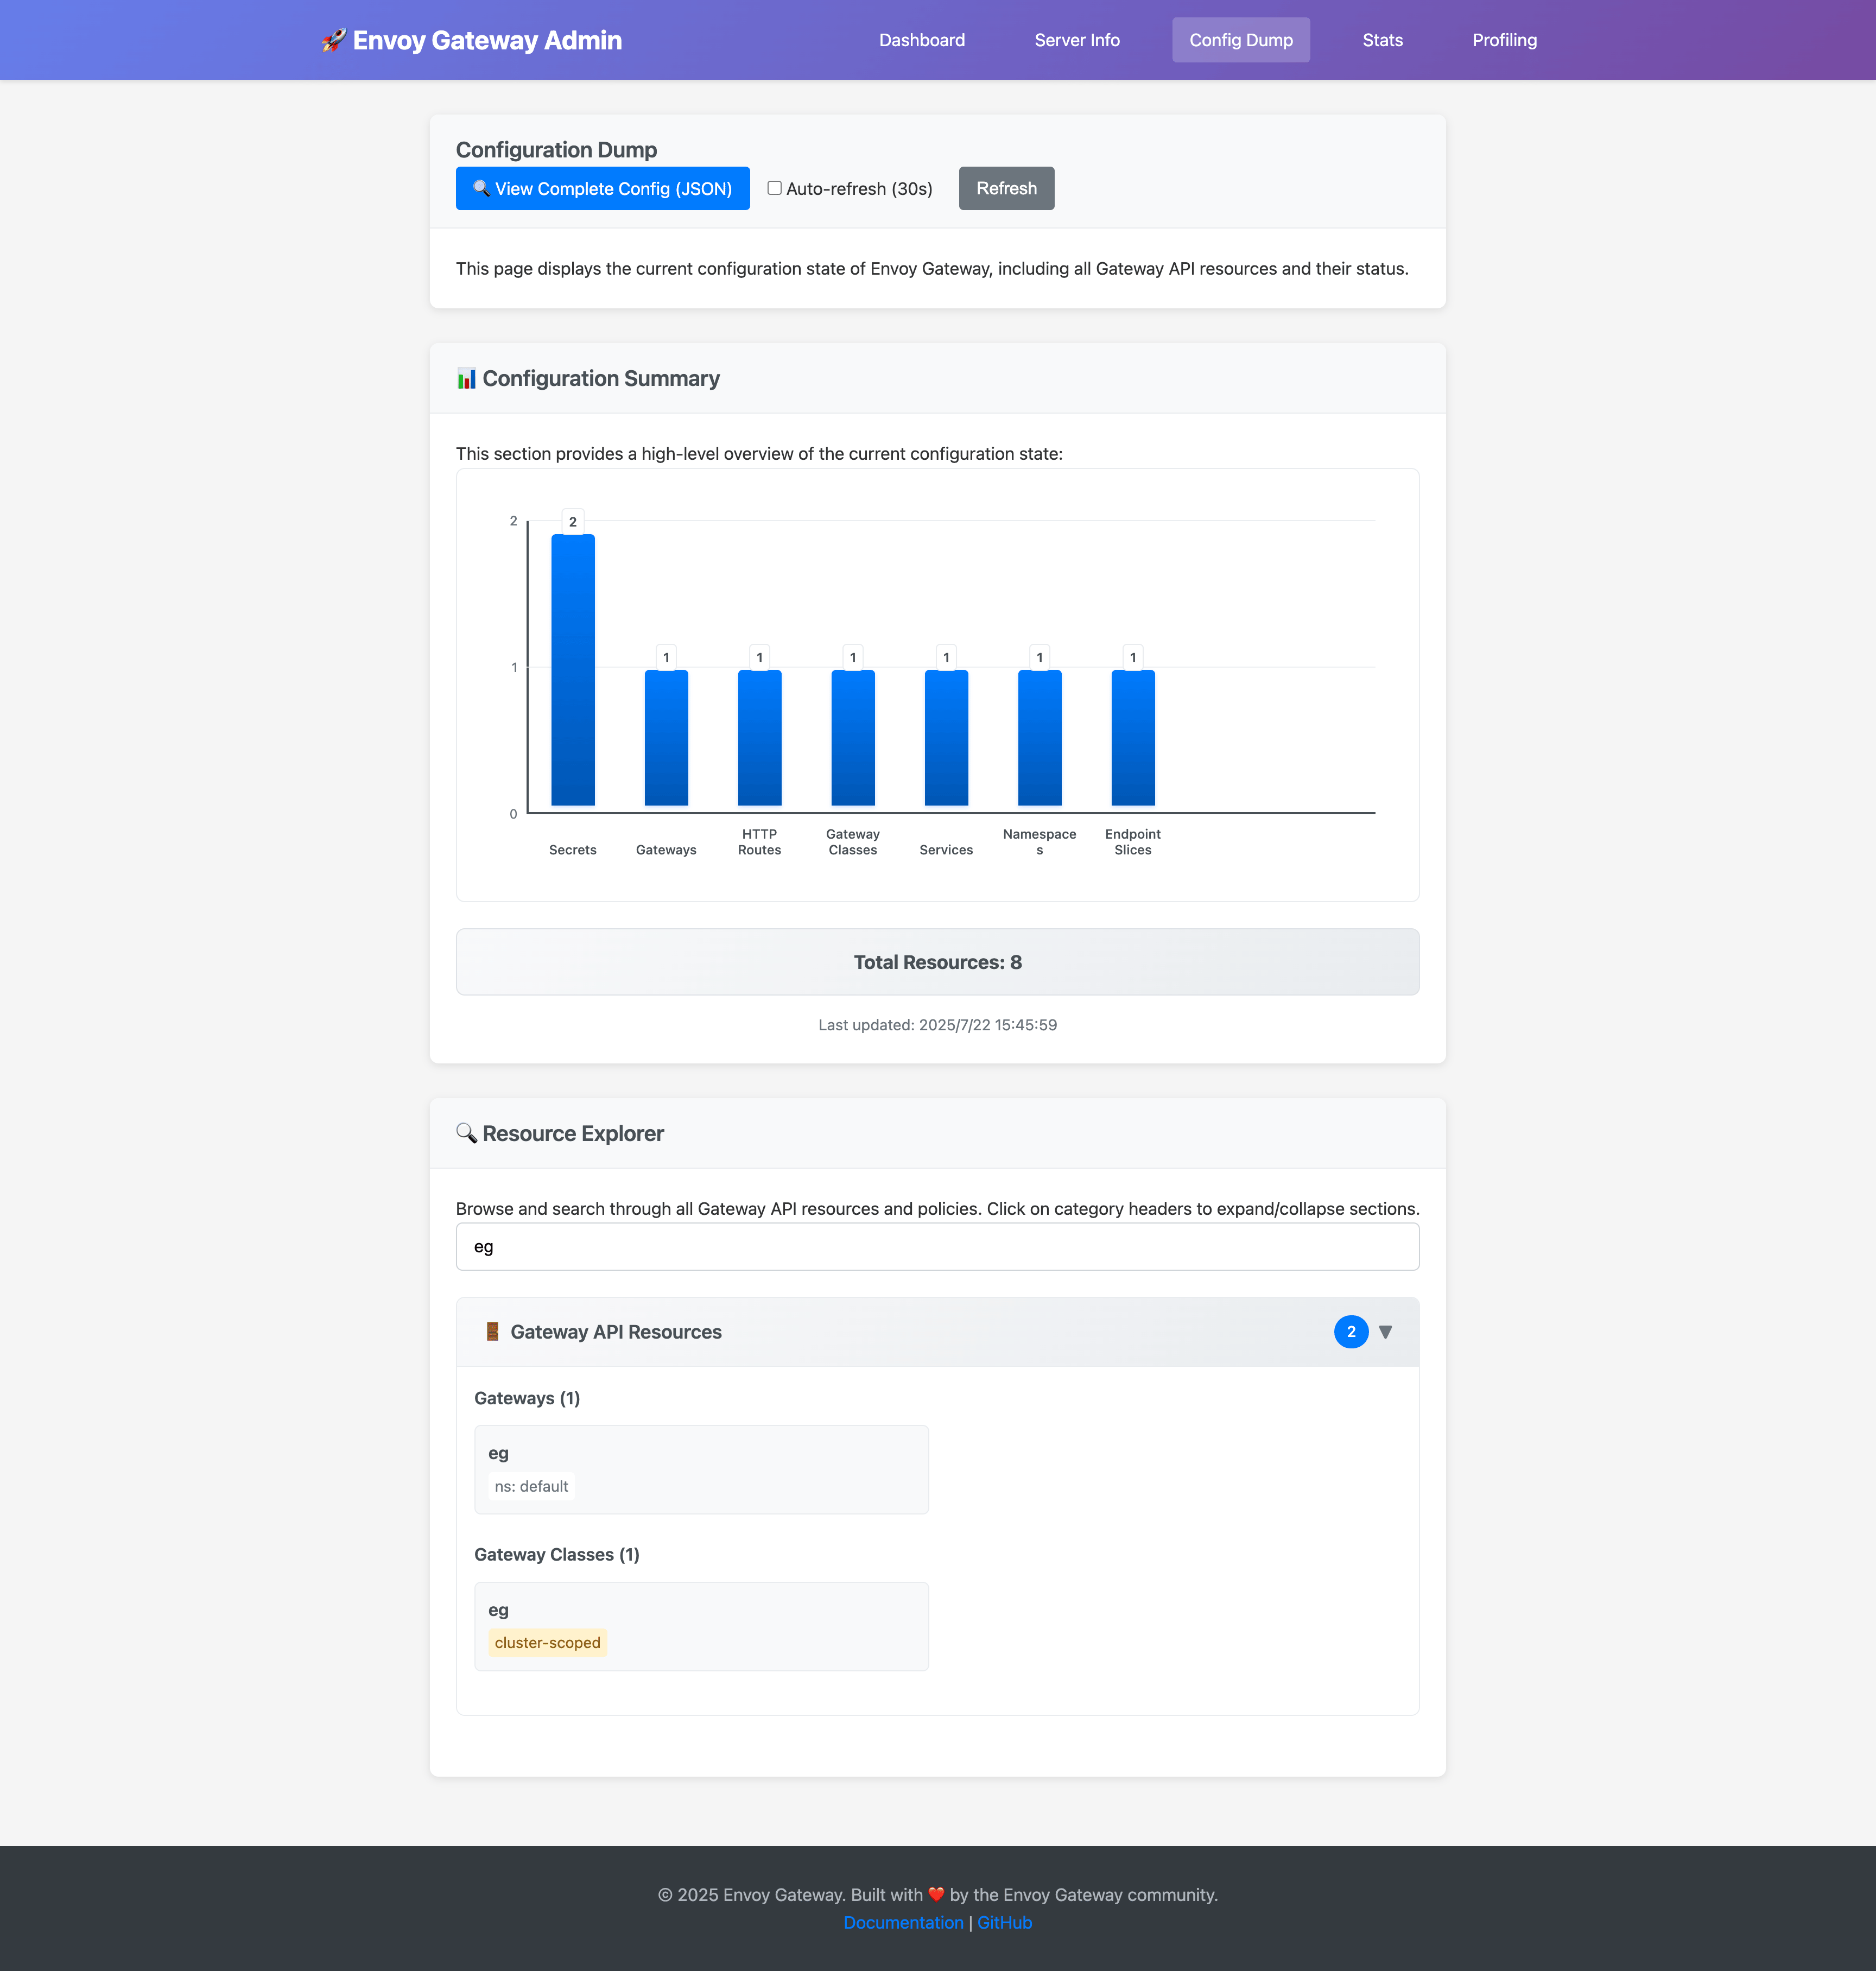
You can also view the complete configuration dump in JSON format:
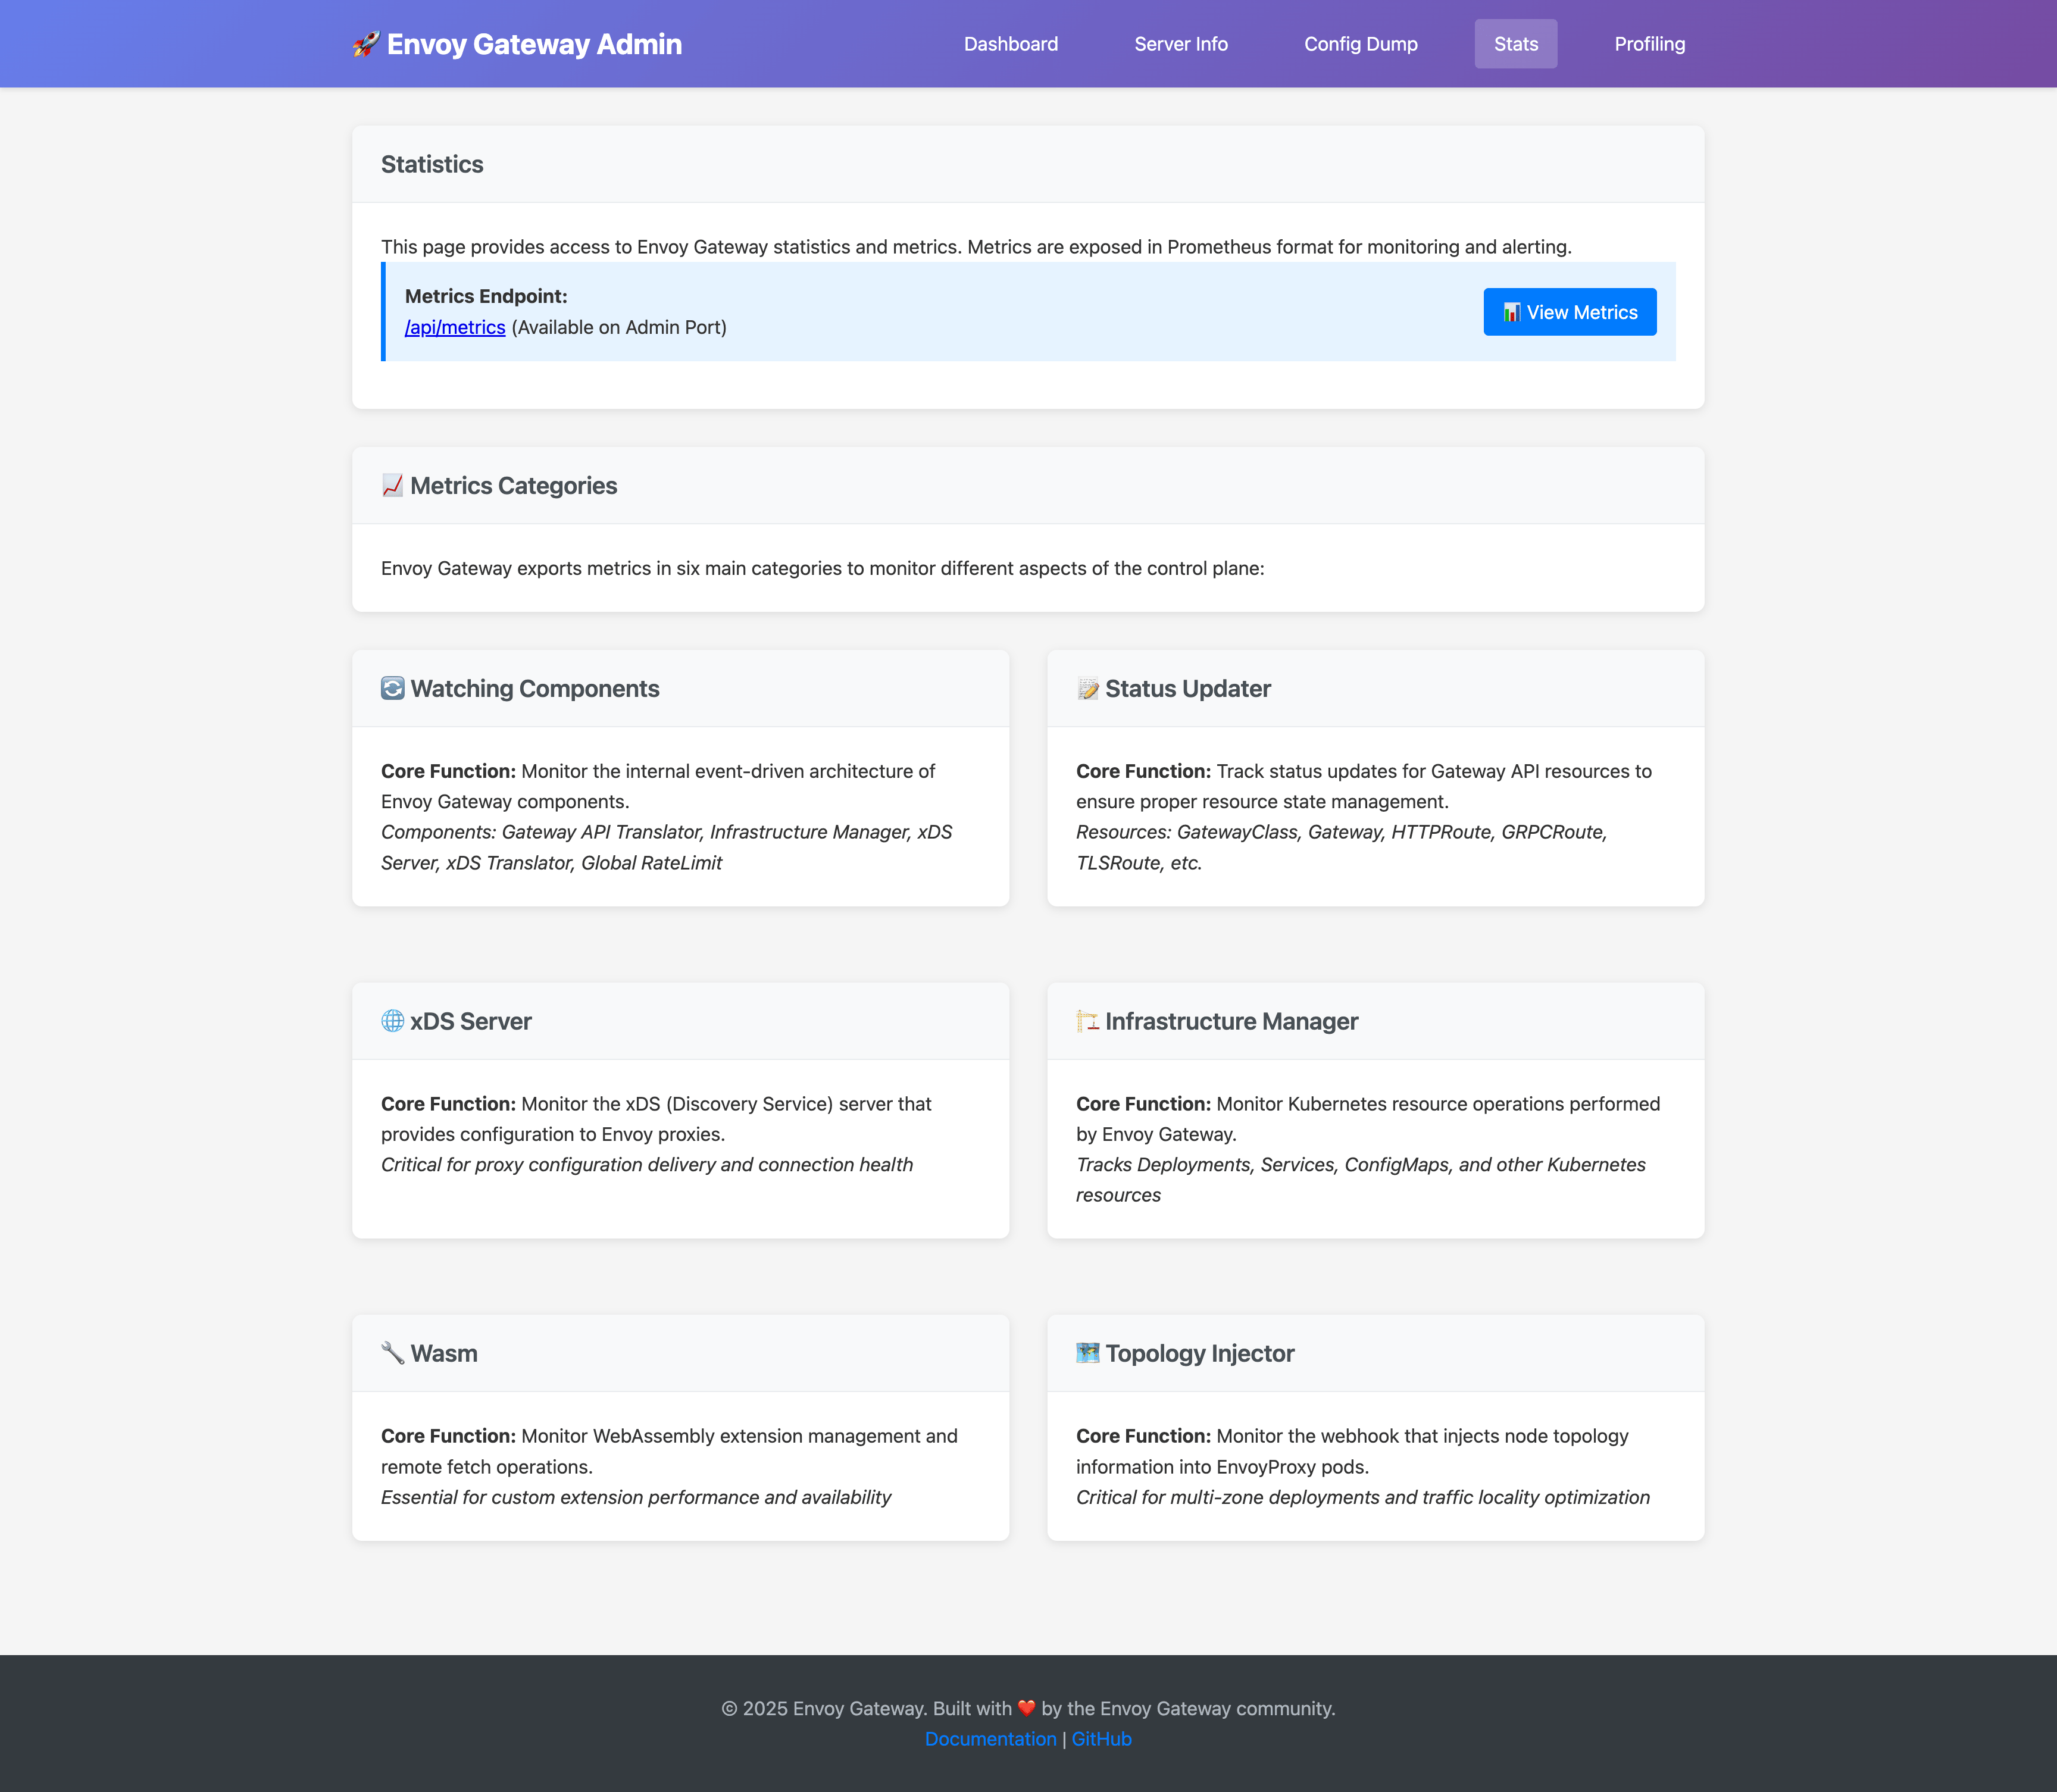
Statistics
The statistics page offers:
- Prometheus Metrics: All control plane metrics in Prometheus format
- Metrics Categories: Organized view of different metric types:
- Watching Components (event-driven architecture metrics)
- Status Updater (resource status update metrics)
- xDS Server (proxy configuration delivery metrics)
- Infrastructure Manager (Kubernetes resource operation metrics)
- Wasm (WebAssembly extension metrics)
- Topology Injector (node topology injection metrics)
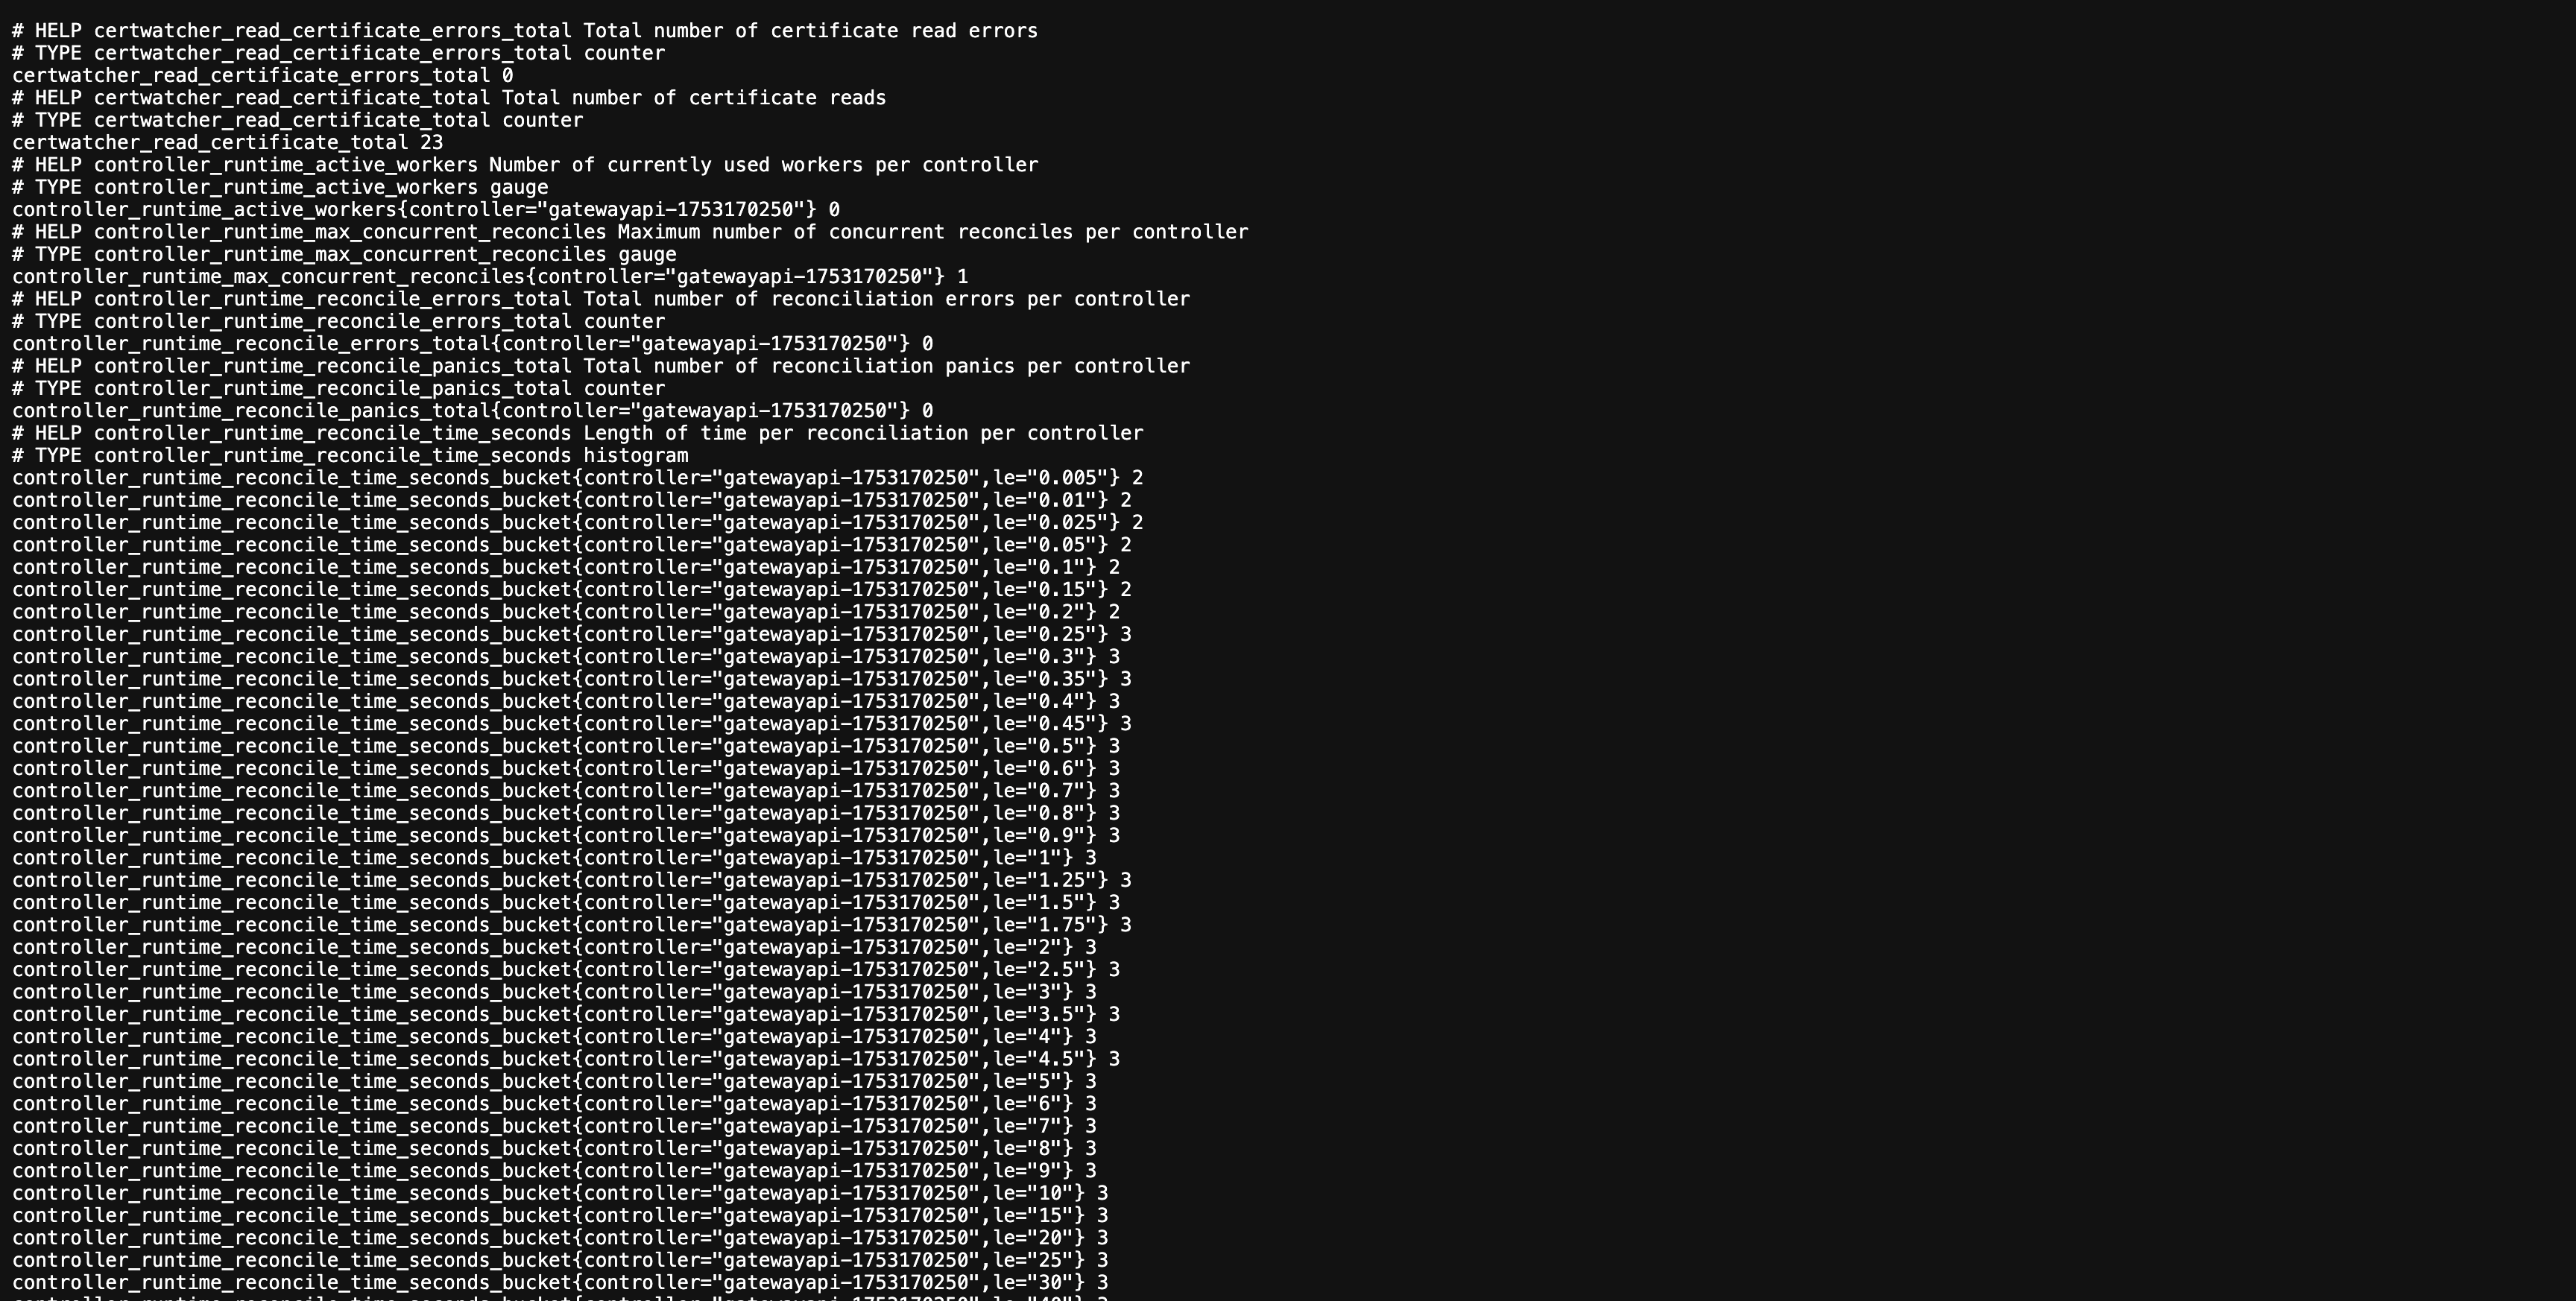
Access metrics directly via: http://localhost:19000/api/metrics
The metrics endpoint provides detailed Prometheus metrics:
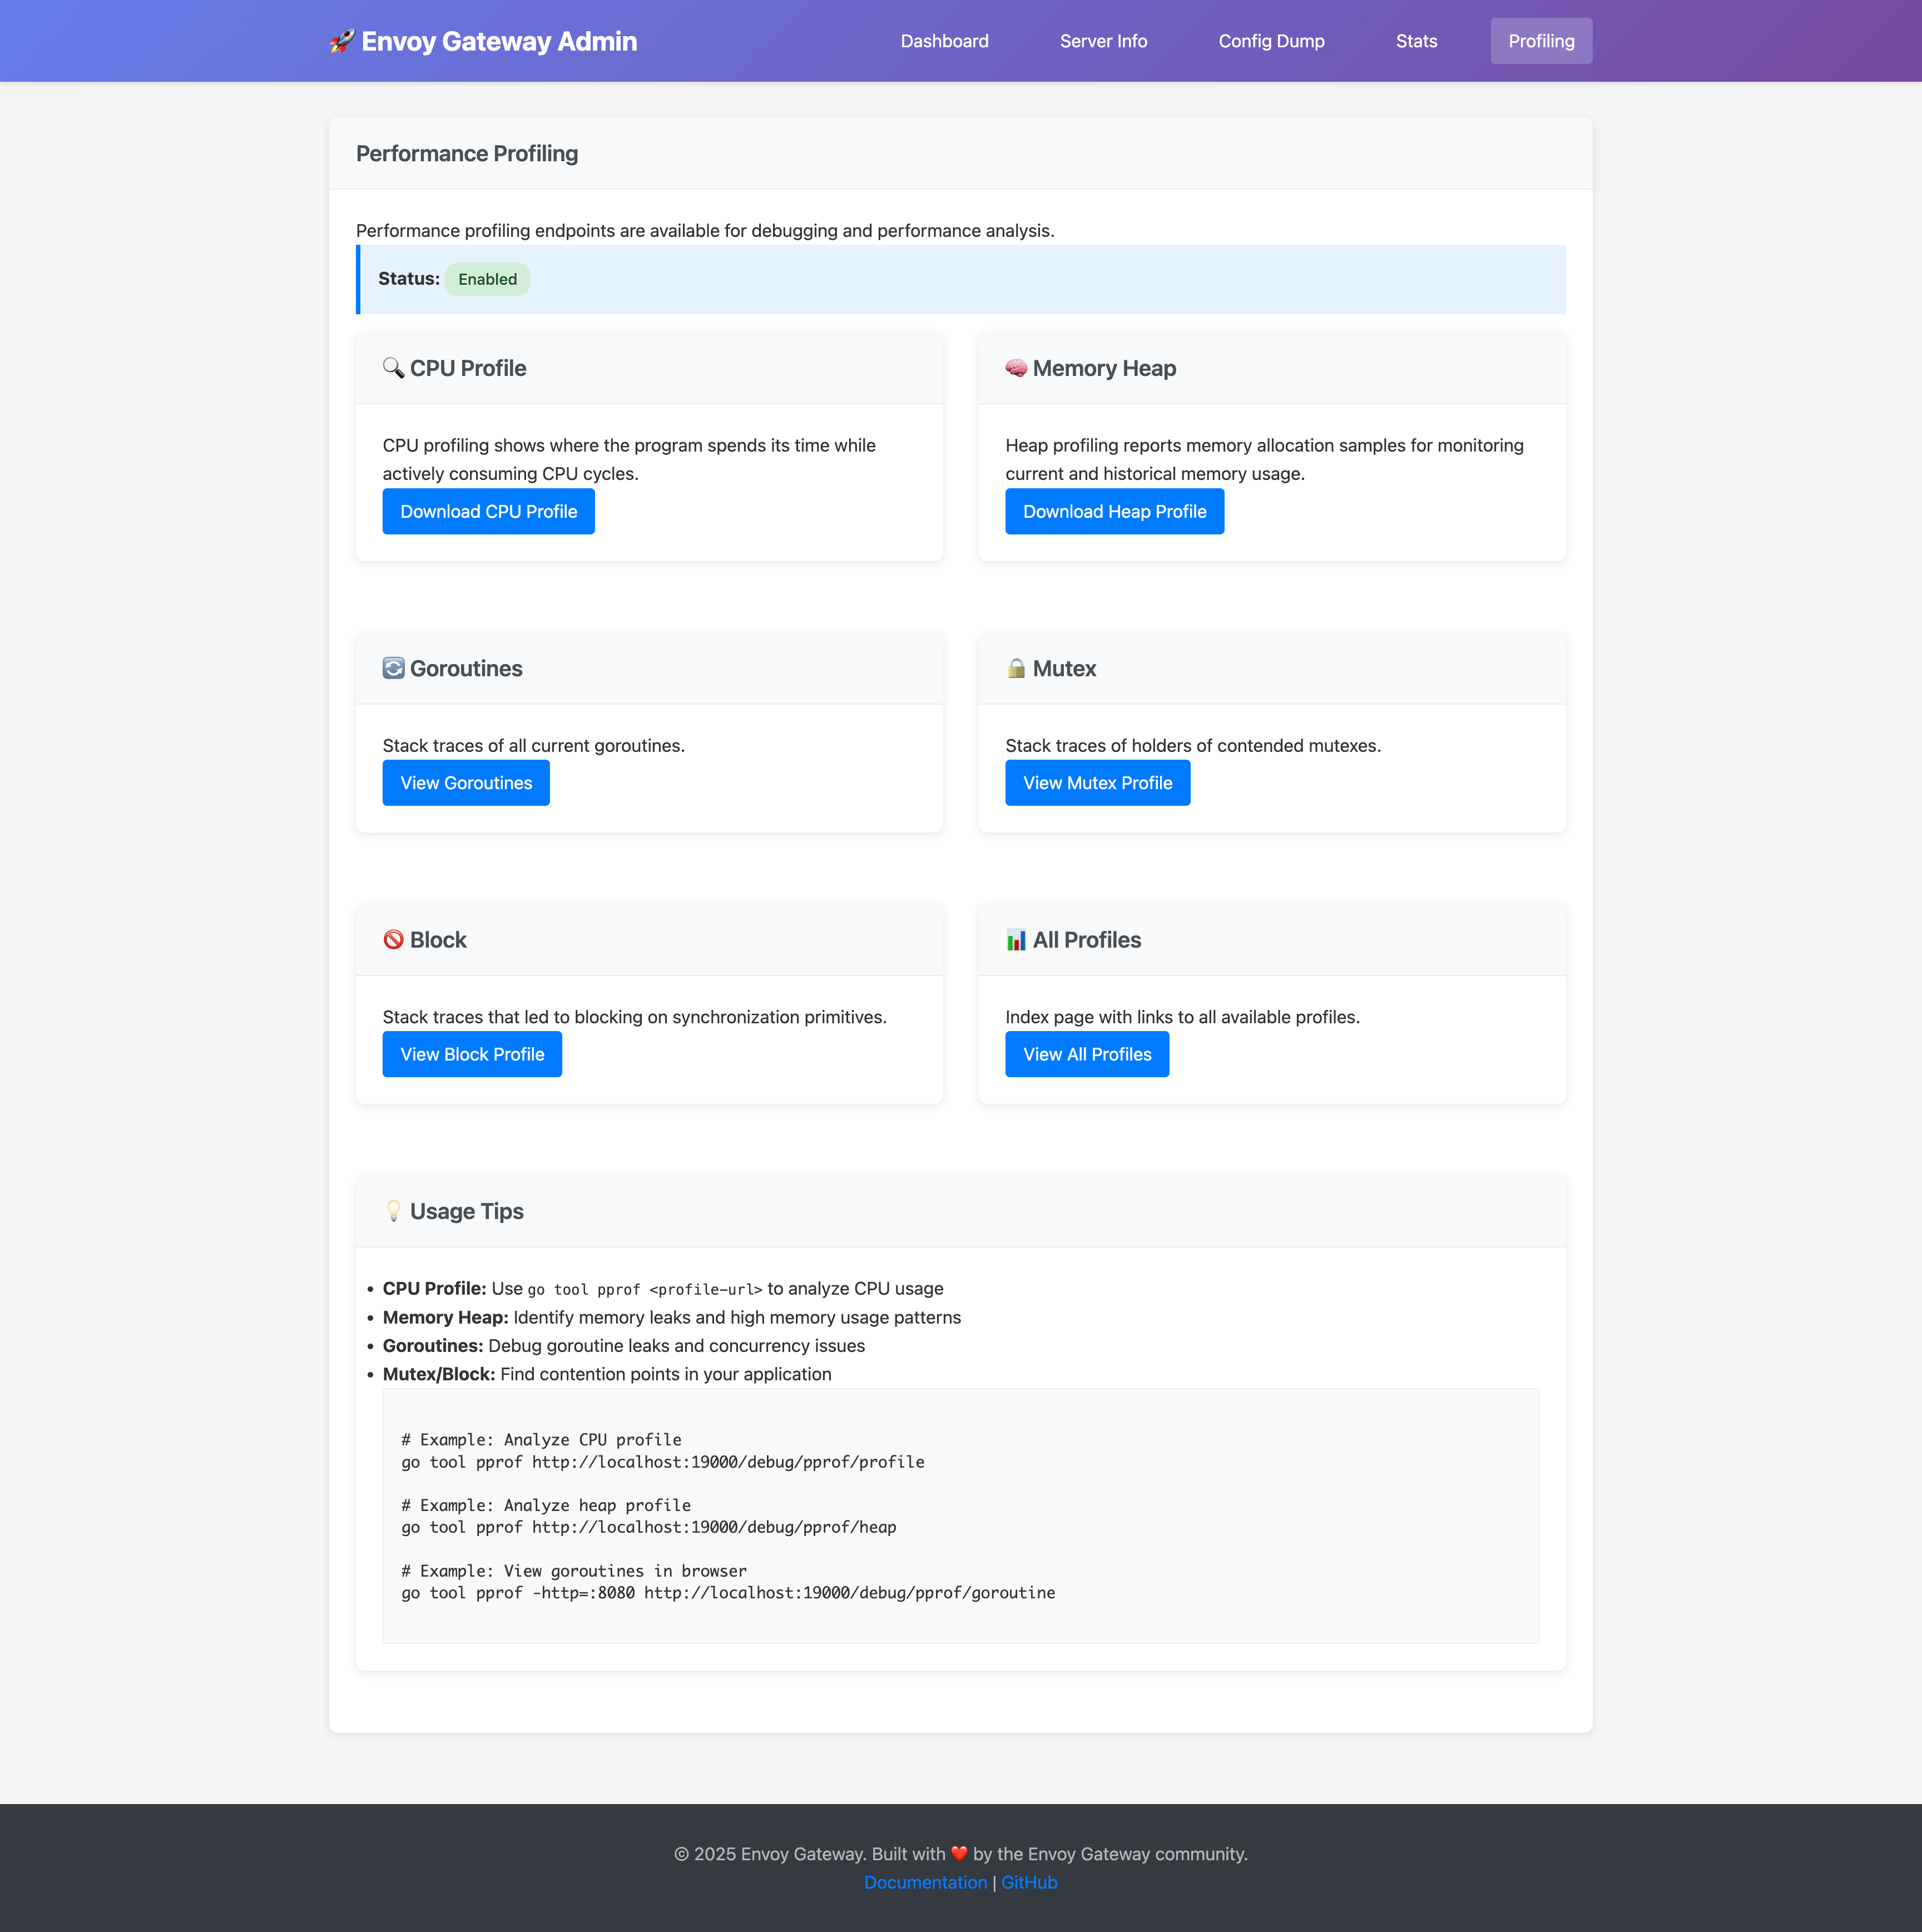
Performance Profiling
When enablePprof is set to true, the profiling page provides:
- CPU Profile: Analyze CPU usage patterns
- Memory Heap: Monitor memory allocation and identify leaks
- Goroutines: Debug concurrency issues and goroutine leaks
- Mutex/Block: Find contention points in the application
Security Warning
Only enable pprof endpoints in development or debugging scenarios. These endpoints can expose sensitive information and should not be enabled in production environments.2 - Advanced: Envoy Proxy Admin Interface
Overview
Platform admins looking to troubleshoot low level aspects of the data plane such as xDS config and heap dump, can directly connect to the Envoy Proxy Admin Interface.
Note: Application Developers may not have access to the namespace where the Envoy Proxy fleet is running and should rely on exported telemetry instead for troubleshooting.
Prerequisites
Follow the steps below to install Envoy Gateway and the example manifest. Before proceeding, you should be able to query the example backend using HTTP.
Expand for instructions
Install the Gateway API CRDs and Envoy Gateway using Helm:
helm install eg oci://docker.io/envoyproxy/gateway-helm --version v1.7.1 -n envoy-gateway-system --create-namespaceInstall the GatewayClass, Gateway, HTTPRoute and example app:
kubectl apply -f https://github.com/envoyproxy/gateway/releases/download/v1.7.1/quickstart.yaml -n defaultVerify Connectivity:
Get the External IP of the Gateway:
export GATEWAY_HOST=$(kubectl get gateway/eg -o jsonpath='{.status.addresses[0].value}')Curl the example app through Envoy proxy:
curl --verbose --header "Host: www.example.com" http://$GATEWAY_HOST/getThe above command should succeed with status code 200.
Get the name of the Envoy service created the by the example Gateway:
export ENVOY_SERVICE=$(kubectl get svc -n envoy-gateway-system --selector=gateway.envoyproxy.io/owning-gateway-namespace=default,gateway.envoyproxy.io/owning-gateway-name=eg -o jsonpath='{.items[0].metadata.name}')Get the deployment of the Envoy service created the by the example Gateway:
export ENVOY_DEPLOYMENT=$(kubectl get deploy -n envoy-gateway-system --selector=gateway.envoyproxy.io/owning-gateway-namespace=default,gateway.envoyproxy.io/owning-gateway-name=eg -o jsonpath='{.items[0].metadata.name}')Port forward to the Envoy service:
kubectl -n envoy-gateway-system port-forward service/${ENVOY_SERVICE} 8888:80 &Curl the example app through Envoy proxy:
curl --verbose --header "Host: www.example.com" http://localhost:8888/getThe above command should succeed with status code 200.
Access
You will need to port-forward to the admin interface port (currently 19000) on the Envoy deployment that corresponds to a Gateway, since it only listens on the localhost
address for security reasons.
Get the name of the Envoy deployment. In this example its for Gateway eg in the default namespace:
export ENVOY_DEPLOYMENT=$(kubectl get deploy -n envoy-gateway-system --selector=gateway.envoyproxy.io/owning-gateway-namespace=default,gateway.envoyproxy.io/owning-gateway-name=eg -o jsonpath='{.items[0].metadata.name}')
Port forward to it.
kubectl port-forward deploy/${ENVOY_DEPLOYMENT} -n envoy-gateway-system 19000:19000 &
If you enter http://localhost:19000 in a browser, you should be able to access the admin interface.
Here’s another example of accessing the /config_dump endpoint to get access of the loaded xDS configuration.
curl http://127.0.0.1:19000/config_dump
Next Steps
There are many other endpoints in the Envoy Proxy Admin interface that may be helpful when debugging.
3 - Configuration Issues
Overview
After configuring and applying resources, you might find that Envoy Gateway does not behave as expected. This guide helps troubleshoot configuration issues.
Many syntax errors and simple semantic issues are caught during resource validation by the Kubernetes API Server, which rejects invalid resources. However, more complex configuration issues require additional debugging.
Prerequisites
Follow the steps below to install Envoy Gateway and the example manifest. Before proceeding, you should be able to query the example backend using HTTP.
Expand for instructions
Install the Gateway API CRDs and Envoy Gateway using Helm:
helm install eg oci://docker.io/envoyproxy/gateway-helm --version v1.7.1 -n envoy-gateway-system --create-namespaceInstall the GatewayClass, Gateway, HTTPRoute and example app:
kubectl apply -f https://github.com/envoyproxy/gateway/releases/download/v1.7.1/quickstart.yaml -n defaultVerify Connectivity:
Get the External IP of the Gateway:
export GATEWAY_HOST=$(kubectl get gateway/eg -o jsonpath='{.status.addresses[0].value}')Curl the example app through Envoy proxy:
curl --verbose --header "Host: www.example.com" http://$GATEWAY_HOST/getThe above command should succeed with status code 200.
Get the name of the Envoy service created the by the example Gateway:
export ENVOY_SERVICE=$(kubectl get svc -n envoy-gateway-system --selector=gateway.envoyproxy.io/owning-gateway-namespace=default,gateway.envoyproxy.io/owning-gateway-name=eg -o jsonpath='{.items[0].metadata.name}')Get the deployment of the Envoy service created the by the example Gateway:
export ENVOY_DEPLOYMENT=$(kubectl get deploy -n envoy-gateway-system --selector=gateway.envoyproxy.io/owning-gateway-namespace=default,gateway.envoyproxy.io/owning-gateway-name=eg -o jsonpath='{.items[0].metadata.name}')Port forward to the Envoy service:
kubectl -n envoy-gateway-system port-forward service/${ENVOY_SERVICE} 8888:80 &Curl the example app through Envoy proxy:
curl --verbose --header "Host: www.example.com" http://localhost:8888/getThe above command should succeed with status code 200.
To demonstrate debugging techniques, let’s apply an intentionally incorrect HTTPRoute configuration with a non-existent backend.
cat <<EOF | kubectl apply -f -
apiVersion: gateway.networking.k8s.io/v1
kind: HTTPRoute
metadata:
  name: backend
  namespace: default
spec:
  hostnames:
  - www.example.com
  parentRefs:
  - group: gateway.networking.k8s.io
    kind: Gateway
    name: eg
  rules:
  - backendRefs:
    - group: ""
      kind: Service
      name: backend-does-not-exist
      port: 3000
      weight: 1
    matches:
    - path:
        type: PathPrefix
        value: /
EOF
Save and apply the following resource to your cluster:
---
apiVersion: gateway.networking.k8s.io/v1
kind: HTTPRoute
metadata:
  name: backend
  namespace: default
spec:
  hostnames:
  - www.example.com
  parentRefs:
  - group: gateway.networking.k8s.io
    kind: Gateway
    name: eg
  rules:
  - backendRefs:
    - group: ""
      kind: Service
      name: backend-does-not-exist
      port: 3000
      weight: 1
    matches:
    - path:
        type: PathPrefix
        value: /
Checking Resource Status
The status field in your resource definitions is your primary troubleshooting tool. It provides insights into whether a resource has been Accepted or not, along with the reason for rejection.
Using kubectl
This example below shows why an HTTPRoute has been Accepted but the ResolvedRefs condition is false because the backend does not exist.
Note: Almost all resources have a status field, so be sure to check them all.
kubectl get httproute/backend -o yaml
apiVersion: gateway.networking.k8s.io/v1
kind: HTTPRoute
metadata:
  name: backend
  namespace: default
spec:
  hostnames:
  - www.example.com
  parentRefs:
  - group: gateway.networking.k8s.io
    kind: Gateway
    name: eg
  rules:
  - backendRefs:
    - group: ""
      kind: Service
      name: backend-does-not-exist
      port: 3000
      weight: 1
    matches:
    - path:
        type: PathPrefix
        value: /
status:
  parents:
  - conditions:
    - lastTransitionTime: "2025-03-08T02:07:53Z"
      message: Route is accepted
      observedGeneration: 3
      reason: Accepted
      status: "True"
      type: Accepted
    - lastTransitionTime: "2025-03-08T02:07:53Z"
      message: Service default/backend-does-not-exist not found
      observedGeneration: 3
      reason: BackendNotFound
      status: "False"
      type: ResolvedRefs
    controllerName: gateway.envoyproxy.io/gatewayclass-controller
    parentRef:
      group: gateway.networking.k8s.io
      kind: Gateway
      name: eg
Using egctl
The egctl CLI tool can quickly fetch the status of multiple resources at once:
egctl x status all -A
NAME              TYPE       STATUS    REASON
gatewayclass/eg   Accepted   True      Accepted

NAMESPACE   NAME         TYPE         STATUS    REASON
default     gateway/eg   Programmed   True      Programmed
                         Accepted     True      Accepted

NAMESPACE   NAME                TYPE           STATUS    REASON
default     httproute/backend   ResolvedRefs   False     BackendNotFound
                                Accepted       True      Accepted
Follow the instructions here to install egctl.
Using kube-state-metrics
For large-scale deployments, kube-state-metrics can help monitor the status of Envoy Gateway resources. For more details, refer to the Observability Guide.
Traffic
If a configuration is not accepted, Envoy Gateway assigns a direct_response to the affected route, causing clients to receive an HTTP 500 error.
curl --verbose --header "Host: www.example.com" http://$GATEWAY_HOST/get
*   Trying 127.0.0.1:80...
* Connected to 127.0.0.1 (127.0.0.1) port 80
> GET /get HTTP/1.1
> Host: www.example.com
> User-Agent: curl/8.7.1
> Accept: */*
>
* Request completely sent off
< HTTP/1.1 500 Internal Server Error
< date: Sat, 08 Mar 2025 02:25:32 GMT
< content-length: 0
<
* Connection #0 to host 127.0.0.1 left intact
If you inspect the access logs in the pod logs:
kubectl logs -n envoy-gateway-system -l gateway.envoyproxy.io/owning-gateway-namespace=default,gateway.envoyproxy.io/owning-gateway-name=eg -c envoy | grep start_time | jq
{
  ":authority": "www.example.com",
  "bytes_received": 0,
  "bytes_sent": 0,
  "connection_termination_details": null,
  "downstream_local_address": "10.1.21.65:10080",
  "downstream_remote_address": "192.168.65.4:45050",
  "duration": 0,
  "method": "GET",
  "protocol": "HTTP/1.1",
  "requested_server_name": null,
  "response_code": 500,
  "response_code_details": "direct_response",
  "response_flags": "-",
  "route_name": "httproute/default/backend/rule/0/match/0/www_example_com",
  "start_time": "2025-03-08T02:25:32.588Z",
  "upstream_cluster": null,
  "upstream_host": null,
  "upstream_local_address": null,
  "upstream_transport_failure_reason": null,
  "user-agent": "curl/8.7.1",
  "x-envoy-origin-path": "/get",
  "x-envoy-upstream-service-time": null,
  "x-forwarded-for": "192.168.65.4",
  "x-request-id": "54c4c2f9-d209-4aa0-8870-342bc6622d1a"
}
and find the following entries
"response_code": "500",
"response_code_details": "direct_response"
this likely indicates a configuration issue. Review the relevant resource status for resolution steps.